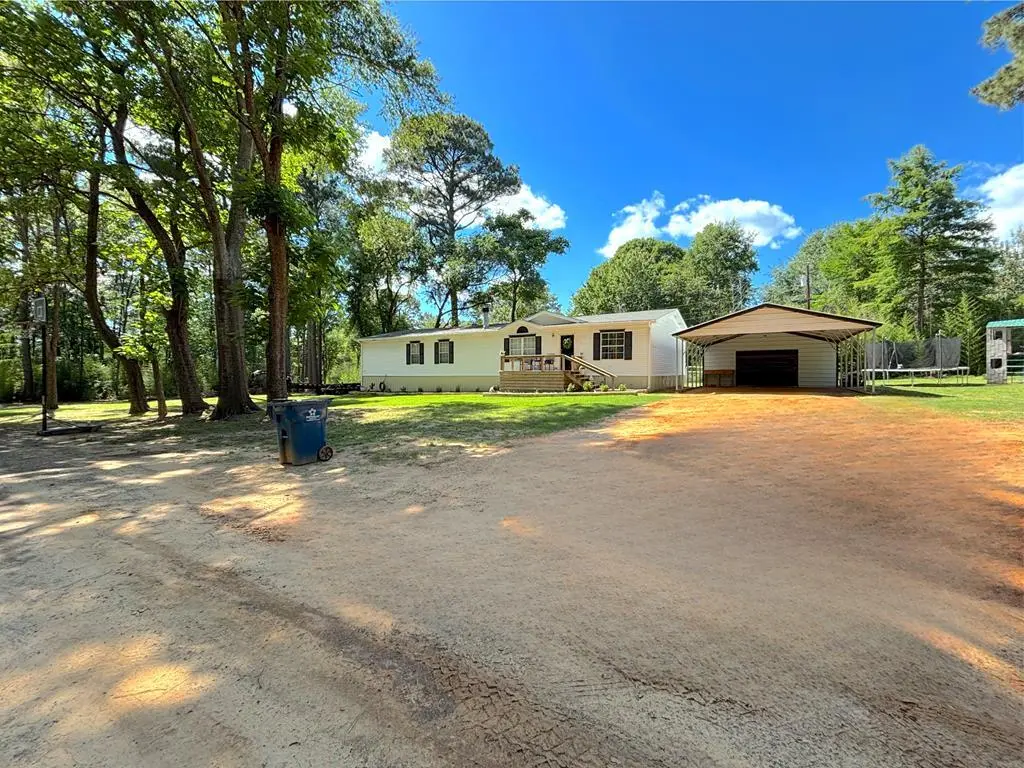
19792 Creekside Cir
Emerald Bay, TX 75701
$173,600C-
4 bd · 2.0 ba ·
2,059 sqft ·
Built 1999
· Land
· Active
· 38 DOM
Cashflow @ list (25.0% down · 7.5%)
Estimated rent
$1,848/mo
Mortgage (P&I)
−$910
Tax + insurance
−$289
HOA
−$50
Vac / Maint / Mgmt
−$388
Net cashflow
$210/mo
Annual
$2,522/yr
Cap rate
7.75%
Cash-on-cash
5.19%
DSCR
1.23
1% rule
1.06%
Cash to close
$48,608
Investor read
- This is a 4-bed/2.0-bath land listed at $174k.
- At list price, monthly cash flow is $210 ($3k/yr) — positive.
- The deal already cash-flows at list — no discount required.
- Meets the 1% rule at list price ($2k rent vs $174k).
- It's been on market 38 days — a 3% lower offer ($168k) is reasonable based on typical stale-listing flexibility.
- Recommended offer: $168k (3.0% below list) — sets the bar for market timing.
- Local home prices are declining (-3.0%/yr); year-one equity from $1k of loan paydown is wiped out by about $5k of value loss. Plan a longer hold.
- Location reads 71/100 on livability (#293 in TX) — a middle-class / working-renter tenant base. Strengths: crime A+, housing A+, employment A; Watch: amenities F, commute F, health & safety D-.
- Tyler ISD (urban): math 39% / reading 38% proficiency, ranked #449 of 826 in TX (top 54%) — families likely to look elsewhere, expect single-tenant / working-renter base with shorter leases; 66% free/reduced lunch — lower-income household profile, screen leases tightly.
- Market conditions: Rents rising (+3.7%/yr); 327 active listings in the ZIP; 595 units permitted in Smith County in 2024 (45 in 5+ unit buildings).
- Smith County population projected at +24% by 2050 — long-run rental-demand tailwind backs the buy-and-hold thesis.
- 2 sale attempts; this cycle's ask has dropped $18.19M (99%) from the opening price — seller is motivated, your offer sets the floor, not the list.
- Climate carrying-cost: major wind risk, 62% chance of damaging wind over 30y; extreme-heat days projected 7→25/yr by 2055 (HVAC capex compounding) — expect insurance premiums to compound above CPI over the hold.
- Cap rate 7.7% vs local median 2.9% in Emerald Bay — top-decile yield for the area; either an underpriced asset or a hidden risk that comps aren't pricing in. Stress-test before assuming the spread holds.
- This rent runs 33% of the median local income ($66k/yr) — at the standard rent-burdened threshold; future hikes will face affordability resistance.
Questions for listing agent
- It's been on market 38 days. Have you received any prior offers? Is the seller open to a 3% concession, seller financing, or rate buy-down credit?
- What does the HOA fee cover, when was the last increase, and are there any pending special assessments or reserve-fund shortfalls?
- Is there a deadline driving the sale (1031 exchange, divorce, estate, relocation)? That informs how much negotiation room exists.
- What's the average days-on-market for RENTAL listings here right now (not sales)? A rising rental-DOM trend means longer vacancies and softer asking-rent achievability than the comps imply.
- What's the recent tenant-quality profile in this submarket — average credit score on applications, eviction rate, late-payment / NSF rate, and stable-employment percentage? A property-management company in the area should have these aggregated.
- How much new for-sale + rental construction is in the pipeline within 1–3 miles? Heavy new supply typically softens prices + rents 12–24 months out; constrained supply supports both.
CashFlowRE · CFR-TTP53VF5BCFA0E
· Data 1 day ago
cashflowre.app · 2026-05-29