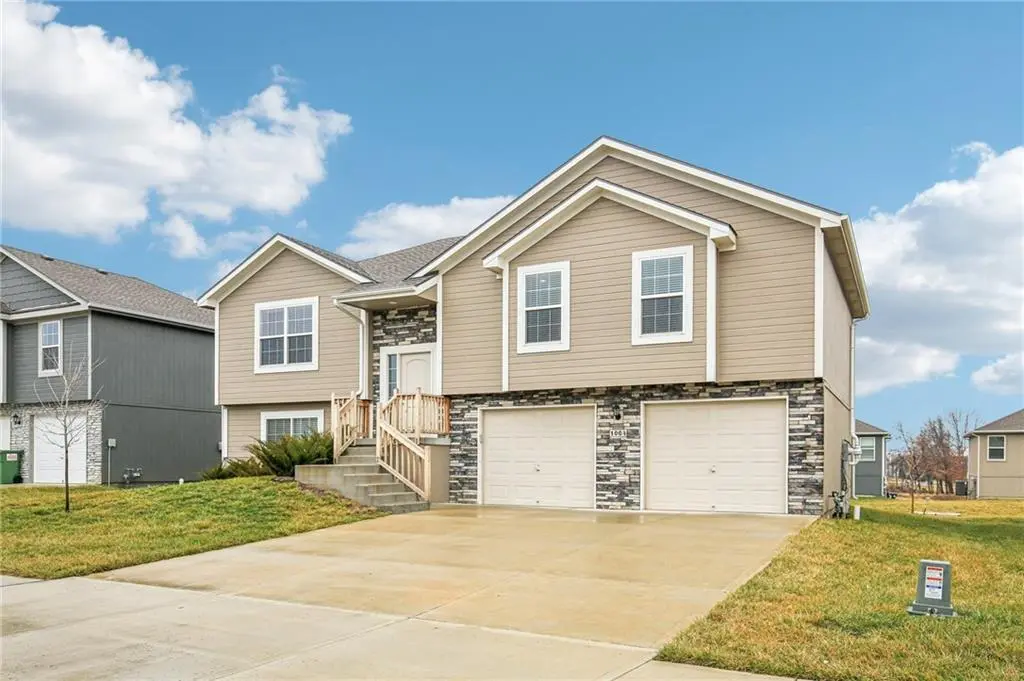
1004 NW High View Dr
Grain Valley, MO 64029
$379,900D-
4 bd · 3.0 ba ·
2,488 sqft ·
Built 2023
· SingleFamily
· Active
· 82 DOM
Cashflow @ list (25.0% down · 7.5%)
Estimated rent
$2,351/mo
Mortgage (P&I)
−$1,992
Tax + insurance
−$531
HOA
−$45
Vac / Maint / Mgmt
−$494
Net cashflow
$-710/mo
Annual
$-8,523/yr
Cap rate
4.05%
Cash-on-cash
-8.01%
DSCR
0.64
1% rule
0.62%
Cash to close
$106,372
Investor read
- This is a 4-bed/3.0-bath single-family listed at $380k.
- At list price, monthly cash flow is $-710 ($-9k/yr) — negative.
- To cash-flow at today's rent, offer at most $254k (33.0% below list).
- To meet the 1% rule (rent ≥ 1% of price), the offer needs to be $235k (38.1% below list).
- It's been on market 82 days — a 6% lower offer ($357k) is reasonable based on typical stale-listing flexibility.
- Recommended offer: $235k (38.1% below list) — sets the bar for 1% rule.
- Local home prices are declining (-3.0%/yr); year-one equity from $3k of loan paydown is wiped out by about $11k of value loss. Plan a longer hold.
- Location reads 76/100 on livability (#41 in MO, #3,383 nationally) — a middle-class / working-renter tenant base. Strengths: employment A+, cost of living A+, housing A+; Watch: amenities F, commute F.
- Grain Valley R-V (suburban): math 45% / reading 54% proficiency, ranked #30 of 324 in MO (top 9%) — families likely to look elsewhere, expect single-tenant / working-renter base with shorter leases; only 17% free/reduced lunch — higher-income household profile.
- Market conditions: Rents rising fast (+7.0%/yr); 109 active listings in the ZIP; 8 comparable units currently listed for rent nearby; rentals at typical pace (median 24d on market — plan ~3-4 weeks tenant-placement turnaround); solid renter incomes; 4,002 units permitted in Jackson County in 2024 (2,271 in 5+ unit buildings).
- Jackson County population projected at +4% by 2050 — modest demand growth; plan on rents tracking national, not racing it.
- 2 sale attempts with the ask held roughly flat each time — persistent listings suggest the price (not the market) is what's stuck; bring a comps-based counter.
- This rent runs 31% of the median local income ($92k/yr) — at the standard rent-burdened threshold; future hikes will face affordability resistance.
Questions for listing agent
- What do current leases actually rent for vs. the listed asking? Can we see a recent rent roll and the last 12 months of T-12 income?
- It's been on market 82 days. Have you received any prior offers? Is the seller open to a 38% concession, seller financing, or rate buy-down credit?
- What does the HOA fee cover, when was the last increase, and are there any pending special assessments or reserve-fund shortfalls?
- Why hasn't it sold? Are there any deal-killer items the seller is aware of (foundation, flood, title, zoning, code violations)?
- Is there a deadline driving the sale (1031 exchange, divorce, estate, relocation)? That informs how much negotiation room exists.
- The area grade is low — what's the realistic commute time and amenity access for the typical tenant pool here? Any planned neighborhood developments (good or bad) we should know about?
- What's the average days-on-market for RENTAL listings here right now (not sales)? A rising rental-DOM trend means longer vacancies and softer asking-rent achievability than the comps imply.
- What's the recent tenant-quality profile in this submarket — average credit score on applications, eviction rate, late-payment / NSF rate, and stable-employment percentage? A property-management company in the area should have these aggregated.
CashFlowRE · CFR-TVAPM06BN8EW8X
· Data 3 weeks ago
cashflowre.app · 2026-05-29