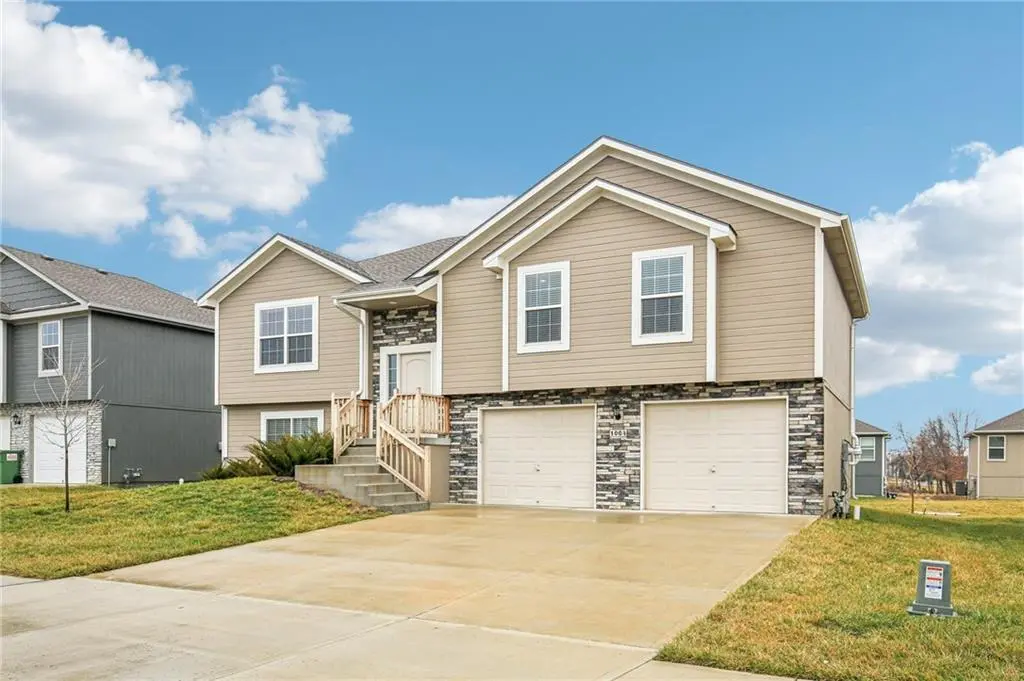
1004 NW High View Dr · Grain Valley, MO
Flood risk No data
- FEMA flood zone
- —
- Chance of flooding over 30 yrs
- —
- Est. flood insurance / yr
- —
Fire risk No data
- Est. fire insurance / yr
- —
Heat risk No data
- Hot days now (above threshold)
- —
- Hot days in 30 yrs
- —
Wind risk No data
- Chance of severe wind over 30 yrs
- —
Air-quality risk No data
- Unhealthy air days now
- —
- Unhealthy air days in 30 yrs
- —
Risk factors via First Street. Map © Google.
Why this score? — see what drove the D- grade
The composite is a weighted blend of 9 inputs, each scored 0–100. Each bar is that input's sub-score; the figure is the points it added to the 100-point composite (weight × sub-score).
- ARV discount +15.0/15.0
- Cash flow +6.1/30.0
- Schools +4.4/10.0
- Rent growth +4.3/5.0
- Livability +3.8/5.0
- Condition / age +2.5/5.0
- 1% rule +1.2/10.0
- DSCR +0.4/10.0
- Appreciation +0.0/10.0
$379,900
🖨 Deal sheet 📄 Offer letter ✓ Due diligence
Listing remarks MLS
SELLER INCENTIVES OFFERED. PLEASE INQUIRE. Now available- This 4BR, 3BA, 2 car garage split level home is beautifully designed, combining modern style, functionality and warmth. Recently built in 2023, the Westridge floor plan features a welcoming naturally bright entry landing that effortlessly guides you to the upper and lower levels, offering a thoughtfully designed layout with comfortable separation of living spaces. The Great Room features a spacious sitting area that is offset by a mantled electric fireplace. The chef’s kitchen is a highly functional, spacious area offering white shaker cabinetry, granite countertops and smart stainless steel appliances. You will also find an elevated deck with stairs leading to the lower level. Scratch resistant luxury hard surface floors flow seamlessly through the home for an added sophisticated touch. The luxurious primary suite boasts a box vault ceiling, walk-in closet, with an en suite double vanity and spa-like walk-in shower with elegant finishes. Two additional bedrooms, perfect for an office, sleeping quarters or personal gym and a full bath all on the main level. The finished basement extends your living space with a secondary Great Room that enhances the home's flexibility for entertaining, a cozy den or game room. The lower level is home to a coat closet, fourth bedroom with double door closet, full bath and laundry. This home is nestled in the Eagle Ridge neighborhood minutes from shopping, dining with quick access to I-70 for easy commuting ad located in the award winning Grain Valley school district. Part of a well-maintained HOA community with minimal fees.
Key facts
- Box vault ceiling
- Elevated deck
- Granite countertops
Tags
Neighborhood map
What this means for you Summary
Snapshot
- This is a 4-bed/3.0-bath single-family listed at $380k.
Deal economics
- At list price, monthly cash flow is $-710 ($-9k/yr) — negative.
- To cash-flow at today's rent, offer at most $254k (33.0% below list).
- To meet the 1% rule (rent ≥ 1% of price), the offer needs to be $235k (38.1% below list).
- Recommended offer: $235k (38.1% below list) — sets the bar for 1% rule.
Location & tenants
- Location reads 76/100 on livability (#41 in MO, #3,383 nationally) — a middle-class / working-renter tenant base. Strengths: employment A+, cost of living A+, housing A+; Watch: amenities F, commute F.
- Grain Valley R-V (suburban): math 45% / reading 54% proficiency, ranked #30 of 324 in MO (top 9%) — families likely to look elsewhere, expect single-tenant / working-renter base with shorter leases; only 17% free/reduced lunch — higher-income household profile.
- Market conditions: Rents rising fast (+7.0%/yr); 109 active listings in the ZIP; 8 comparable units currently listed for rent nearby; rentals at typical pace (median 24d on market — plan ~3-4 weeks tenant-placement turnaround); solid renter incomes; 4,002 units permitted in Jackson County in 2024 (2,271 in 5+ unit buildings).
- This rent runs 31% of the median local income ($92k/yr) — at the standard rent-burdened threshold; future hikes will face affordability resistance.
Forward outlook
- Local home prices are declining (-3.0%/yr); year-one equity from $3k of loan paydown is wiped out by about $11k of value loss. Plan a longer hold.
- Jackson County population projected at +4% by 2050 — modest demand growth; plan on rents tracking national, not racing it.
Negotiation context
- It's been on market 82 days — a 6% lower offer ($357k) is reasonable based on typical stale-listing flexibility.
- 2 sale attempts with the ask held roughly flat each time — persistent listings suggest the price (not the market) is what's stuck; bring a comps-based counter.
Questions for the listing agent
- What do current leases actually rent for vs. the listed asking? Can we see a recent rent roll and the last 12 months of T-12 income?
- It's been on market 82 days. Have you received any prior offers? Is the seller open to a 38% concession, seller financing, or rate buy-down credit?
- What does the HOA fee cover, when was the last increase, and are there any pending special assessments or reserve-fund shortfalls?
- Why hasn't it sold? Are there any deal-killer items the seller is aware of (foundation, flood, title, zoning, code violations)?
- Is there a deadline driving the sale (1031 exchange, divorce, estate, relocation)? That informs how much negotiation room exists.
- The area grade is low — what's the realistic commute time and amenity access for the typical tenant pool here? Any planned neighborhood developments (good or bad) we should know about?
- What's the average days-on-market for RENTAL listings here right now (not sales)? A rising rental-DOM trend means longer vacancies and softer asking-rent achievability than the comps imply.
- What's the recent tenant-quality profile in this submarket — average credit score on applications, eviction rate, late-payment / NSF rate, and stable-employment percentage? A property-management company in the area should have these aggregated.
- How much new for-sale + rental construction is in the pipeline within 1–3 miles? Heavy new supply typically softens prices + rents 12–24 months out; constrained supply supports both.
Investment metrics
- 1% rule
- 0.62% ✗
- Cap rate
- 4.05%
- Cash-on-cash
- -8.01%
- DSCR
- 0.64
- GRM
- 13.5
CMA / ARV
- ARV (median comp)
- $468,426
- List price
- $379,900
- Delta
- -18.90%
- Verdict
- UNDERPRICED
- Comps
- 20 within 1.0 mi
Show comp detail 12 sales within ~0.75 mi
| Address | Dist | Beds/Ba | Sqft | Sold | Price | $/sf | Match |
|---|---|---|---|---|---|---|---|
| 903 NW High View Dr | 0.13mi | 4/3.0 | 2,488 (0%) | 1mo | $379,900 | $153 | 93 |
| 1102 NW Aspen Ct | 0.13mi | 4/3.5 | 2,546 (+2%) | 1mo | $499,900 | $196 | 88 |
| 906 NW Magnolia Ln | 0.31mi | 4/2.5 | 2,373 (-5%) | 2mo | $425,000 | $179 | 74 |
| 1404 NW Maple Dr | 0.21mi | 4/3.0 | 2,230 (-10%) | 1mo | $425,000 | $191 | 72 |
| 801 NW Hickory Ridge Dr | 0.29mi | 4/2.5 | 2,658 (+7%) | 1mo | $453,900 | $171 | 72 |
| 803 NW Hickory Ridge Dr | 0.28mi | 5/3.0 (+1) | 2,637 (+6%) | 2mo | $441,000 | $167 | 71 |
| 1009 NW Burr Oak Ln | 0.39mi | 4/3.5 | 2,650 (+6%) | 1mo | $415,000 | $157 | 68 |
| 605 NW Silverstone Cir | 0.73mi | 4/3.5 | 2,646 (+6%) | 2mo | $398,000 | $150 | 52 |
| 1809 NW Madi Ct | 0.72mi | 3/3.0 (-1) | 2,625 (+6%) | 1mo | $470,000 | $179 | 51 |
| 1806 NW Mya Ct | 0.74mi | 4/3.0 | 2,696 (+8%) | 2mo | $450,000 | $167 | 50 |
| 803 NW Redbud Dr | 0.71mi | 4/3.0 | 2,812 (+13%) | 1mo | $399,900 | $142 | 44 |
| 930 NW Scenic Dr | 0.50mi | 3/2.0 (-1) | 2,130 (-14%) | 1mo | $349,900 | $164 | 43 |
Match score weights: distance 35% · size 25% · config 20% · recency 20%. Top-matched comps best support the ARV.
Projected returns pro-forma
-3.0% appreciation · 7.03% rent growth · sell at horizon
- IRR
- -26.2%
- Equity multiple
- 0.09×
- Total profit
- $-96,875
- Equity at exit
- $56,644
- IRR
- -13.8%
- Equity multiple
- 0.08×
- Total profit
- $-98,367
- Equity at exit
- $32,847
Cash invested: $106,372 (down + closing). Projections, not guarantees.
Landlord ↔ Tenant lean methodology
- Overall (STATE)
- 81 Strongly Landlord-Friendly
- State Missouri
- 81 Strongly Landlord-Friendly · R+10
- County
- — inherits STATE
- City
- — inherits STATE
ZIP-level market 64029
- Home prices YoY
- -24.2%
- Rents YoY
- 7.0%
- Active inventory
- 109
- Price-to-rent
- 13.5×
Monthly cashflow live
- Estimated rent
- $2,351 high interval (Pro) →
- Mortgage (P&I)
- −$1,992
- Tax from tax record
- −$372 /mo · $4,467/yr
- Insurance
- −$158
- HOA
- −$45
- Vacancy / Maint / Mgmt
- −$494
- Net cashflow
- $-710
Break-even live
UW: 25.0% down · 7.5% · 30yr · 1.5% tax · 5.0% vac · 8.0% maint · 8.0% mgmt
Financing live
Cash to close
- Down payment
- $94,975
- Closing costs
- $11,397
- Reserves months
- —
- Total cash needed
- —
Loan-product check · same deal, 3 products live
Conventional
25% down · 7.5% · 30yr
- Down + closing
- —
- Monthly P&I
- —
- Monthly cashflow
- —
- DSCR
- —
- Eligible?
- —
Personal DTI + credit; lowest rate.
DSCR
20% down · 8.5% · 30yr
- Down + closing
- —
- Monthly P&I
- —
- Monthly cashflow
- —
- DSCR
- —
- Eligible?
- —
No personal income docs; deal must DSCR.
Hard money
10% down · 12.0% · 12mo
- Down + closing
- —
- Monthly P&I
- —
- Monthly cashflow
- —
- DSCR
- —
- Eligible?
- —
Short-term bridge; refi at stabilization.
Rent comps 8 comps
| Address | Beds | Baths | Sqft | Rent | $/sqft | DOM | Units | Dist |
|---|---|---|---|---|---|---|---|---|
| 901 NW Hilltop Ln Grain Valley, MO | 4.0 | 3.0 | 1971 | $2,305 | $1.17 | 21d | 1 | 0.12mi |
| 1305 NW High View Dr Grain Valley, MO | 4.0 | 3.0 | 1942 | $2,245 | $1.16 | 43d | 1 | 0.23mi |
| 412 NW Woodbury Dr Grain Valley, MO | 3.0 | 2.0 | 2025 | $1,650 | $0.81 | 23d | 1 | 0.39mi |
| 930 NW Scenic Dr Grain Valley, MO | 3.0 | 2.0 | 1750 | $2,100 | $1.20 | 23d | 1 | 0.51mi |
| 1500 NE Shale Ct Grain Valley, MO | 3.0 | 2.5 | 1427 | $1,845 | $1.29 | 17d | 1 | 0.76mi |
| 203 NE Katie Ct Grain Valley, MO | 4.0 | 3.0 | 2150 | $2,580 | $1.20 | 1d | 1 | 0.91mi |
| 1015 NW Willow Dr Grain Valley, MO | 3.0 | 2.0 | 1590 | $1,395 | $0.88 | 43d | 1 | 1.08mi |
| 1220 NW Sni-A-Bar Blvd Grain Valley, MO | 1.0–3.0 | 1.0–2.5 | 1170 | $1,900 | $1.62 | 1d | 1 | 1.25mi |
HOA detail
- Monthly dues
- $45 · $540/yr
- Likely covers
- electricgym
Listing history 4 events
-
2026-03-09$379,900 Active 1647-char remark
Show marketing remark (1647 chars)
SELLER INCENTIVES OFFERED. PLEASE INQUIRE. Now available- This 4BR, 3BA, 2 car garage split level home is beautifully designed, combining modern style, functionality and warmth. Recently built in 2023, the Westridge floor plan features a welcoming naturally bright entry landing that effortlessly guides you to the upper and lower levels, offering a thoughtfully designed layout with comfortable separation of living spaces. The Great Room features a spacious sitting area that is offset by a mantled electric fireplace. The chef’s kitchen is a highly functional, spacious area offering white shaker cabinetry, granite countertops and smart stainless steel appliances. You will also find an elevated deck with stairs leading to the lower level. Scratch resistant luxury hard surface floors flow seamlessly through the home for an added sophisticated touch. The luxurious primary suite boasts a box vault ceiling, walk-in closet, with an en suite double vanity and spa-like walk-in shower with elegant finishes. Two additional bedrooms, perfect for an office, sleeping quarters or personal gym and a full bath all on the main level. The finished basement extends your living space with a secondary Great Room that enhances the home's flexibility for entertaining, a cozy den or game room. The lower level is home to a coat closet, fourth bedroom with double door closet, full bath and laundry. This home is nestled in the Eagle Ridge neighborhood minutes from shopping, dining with quick access to I-70 for easy commuting ad located in the award winning Grain Valley school district. Part of a well-maintained HOA community with minimal fees.
-
2026-02-19historical $2,299
-
2026-02-06price $2,299
-
2026-02-05$2,525
ⓘ Source: listings_history table (triggers on properties + properties_extension) + one-shot
backfill from property_details.listing_events for pre-trigger history.
Tax reassessment forecast MO · Resets to sale price
- Current annual tax
- $4,467 · $372/mo
- Projected year-2 tax
- $4,467 · $372/mo
- Expected delta
- $0/yr ($0/mo · 0.0%)
ⓘ Screening estimate from a state-policy table — verify with the county assessor before closing.
Nearby sold comps map
Loading sold comps map…
Walkable amenities ~0.75 mi
Loading nearby amenities…
Taxation est. · year 1
- Rental income
- $28,216
- − Mortgage interest
- −$21,280
- − Property taxes
- −$4,467
- − Insurance
- −$1,900
- − Repairs & maintenance
- −$2,257
- − Management
- −$2,257
- − HOA
- −$540
- − Depreciation
- −$11,052
- Taxable loss
- −$15,537
- Est. tax savings @ 24.0%
- +$3,729
- After-tax cash flow
- $-4,794/yr
For passive investors: Depreciation is non-cash, so a rental often shows a tax loss while cash-flowing — sheltering income. Rental losses are passive: they offset passive income freely, and up to $25,000/yr can offset ordinary (W-2) income if you actively participate and your MAGI is under $100k (phasing out to $0 by $150k); unused losses carry forward. On sale, claimed depreciation is recaptured at up to 25%, and gains may owe capital-gains tax (a 1031 exchange can defer both). Figures are a year-1 estimate at your 24.0% rate — not tax advice; consult a CPA.
Schools (NCES district)
- District
- Grain Valley R-V
- NCES district ID
- 2913080
- Math proficiency
- 45% ▼ -4.00%
- Reading proficiency
- 54% ▼ -1.00%
- Median HH income
- $67,451
- Composite
- 44.01/100
- National rank
- #2888
- State rank
- #30 of 324 in MO
Livability — Grain Valley
- Score
- 76/100
- State rank
- #41
- US rank
- #3383
Category grades
Schools grade is shown separately in the Schools card above.
Census & demographics
- Census place
- Grain Valley, MO
- County
- Jackson County · 687,798 people
- City population
- 21,961
- Metro
- Kansas City, MO-KS
- Population (ZIP)
- 21,961
- Household income
- $91,704
- Rent vs Own
- Severe rent burden
- 218.0
Population outlook (Jackson County) Hauer SSP2
- Today (2025)
- 719,589 people
- By 2030
- 731,456 · +1.6%
- By 2040
- 746,689 · +3.8%
- By 2050
- 749,289 · +4.1%
- By 2075
- 736,227 · +2.3%
- By 2100
- 668,210 · -7.1%
Race, ethnicity, and origin ACS 2023
- Neighborhood character
- Predominantly White (86%)
- Race & ethnicity
- White 86% Two or more races 5% Hispanic / Latino 5% Black 5%
- Common ancestry
- Italian 17% Lithuanian 2% Slovak 2%
- Foreign-born
- 2% · Canada
- Languages at home
- 97% English-only · Spanish 2%
Political lean MEDSL · Jackson
- 2024 margin
- D (+19.3) · D 58.9% · R 39.5% · Other 1.6%
- 2008→2024 swing
- -6.1pp toward R · 2008: 25.4pp · 2024: 19.3pp
- All cycles
- 2024: D+19.3 2020: D+22.0 2016: D+16.6 2012: D+19.0 2008: D+25.4
Not yet ingested
- Civics
- —
Market trends
- HPI YoY
- ▼ -72.90%
- Current HPI
- 228.5568
- Rent YoY
- ▲ 7.03%
- Metro
- Kansas City, MO-KS
- State GDP YoY
- ▲ 1.84%
- F500 in state
- 20
Industry mix (Fortune 500 HQ in MO)
| Industry | F500 HQs | Revenue |
|---|---|---|
| Healthcare | 1 | $163B |
|
||
| Insurance | 1 | $21B |
|
||
| Industrial Technology | 1 | $17B |
|
||
| Retail | 1 | $16B |
|
||
| Industrial Distribution | 1 | $10B |
|
||
| Utilities | 1 | $9B |
|
||
Price history
+14945.5% since first listed4 events — show timeline
- 2026-03-09 Listed $379,900 Heartland MLS as Distributed by MLS Grid
- 2026-02-19 Rental Removed $2,299 RENTLY
- 2026-02-06 Price Changed $2,299 RENTLY
- 2026-02-05 Listed for Rent $2,525 RENTLY
Property tax history
+268.8%/yrLatest (2025): $4,467 · +1209.4% YoY. Source: county tax records.
Cash-flow waterfall
monthlySold comps — $/sqft
last 12 mo · ≤1 miLoading sold comps…