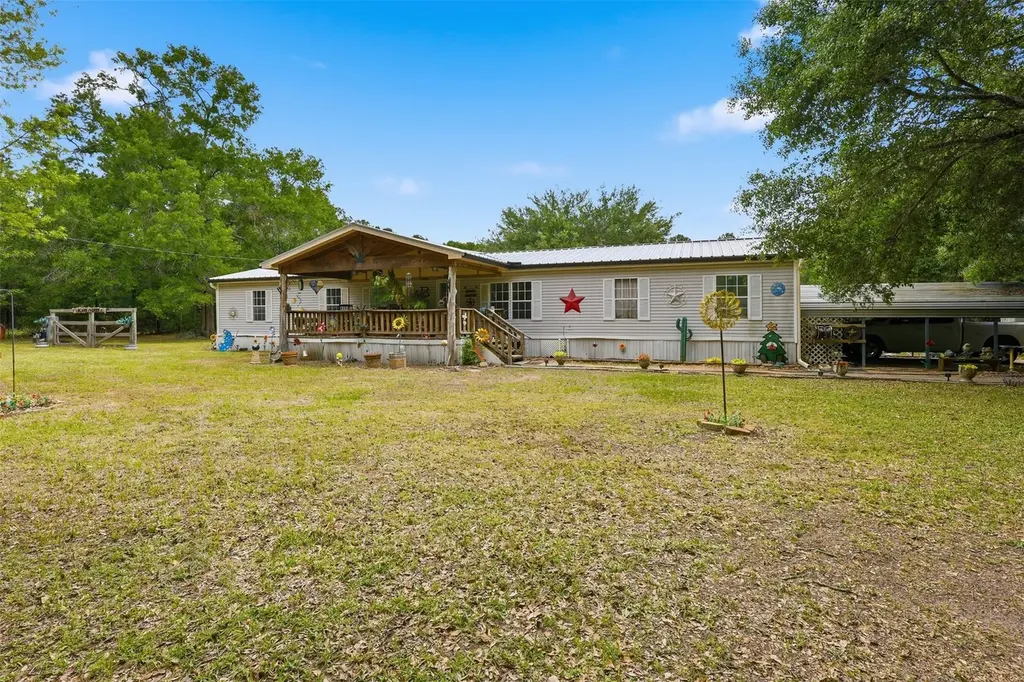
31232 Kyle Dr
Todd Mission, TX 77484
$240,000D-
4 bd · 2.5 ba ·
2,376 sqft ·
Built 1997
· SingleFamily
· Pending
· 23 DOM
Cashflow @ list (25.0% down · 7.5%)
Estimated rent
$2,005/mo
Mortgage (P&I)
−$1,259
Tax + insurance
−$381
HOA
−$0
Vac / Maint / Mgmt
−$421
Net cashflow
$-56/mo
Annual
$-668/yr
Cap rate
6.01%
Cash-on-cash
-0.99%
DSCR
0.96
1% rule
0.84%
Cash to close
$67,200
Investor read
- This is a 4-bed/2.5-bath single-family listed at $240k.
- At list price, monthly cash flow is $-56 ($-668/yr) — negative.
- To cash-flow at today's rent, offer at most $230k (4.1% below list).
- To meet the 1% rule (rent ≥ 1% of price), the offer needs to be $201k (16.4% below list).
- It's been on market 23 days — a 2% lower offer ($236k) is reasonable based on typical stale-listing flexibility.
- Recommended offer: $201k (16.4% below list) — sets the bar for 1% rule.
- Local home prices are declining (-3.0%/yr); year-one equity from $2k of loan paydown is wiped out by about $7k of value loss. Plan a longer hold.
- Location reads 67/100 on livability (#549 in TX) — a middle-class / working-renter tenant base. Strengths: employment A+, cost of living A+, housing A+; Watch: amenities F, commute F, health & safety F.
- Waller ISD (rural): math 30% / reading 35% proficiency, ranked #532 of 826 in TX (top 64%) — families likely to look elsewhere, expect single-tenant / working-renter base with shorter leases.
- Zoned schools: Fields Store El (math 47% / reading 43%, grade D-, #1,133 of 4,322 statewide, top 27%, 663 students, 63% FRL); Waller H S (math 25% / reading 40%, grade F, #1,029 of 1,632 statewide, top 64%, 2,639 students, 62% FRL) — zoned schools at 62% FRL track the district average.
- Market conditions: Rents falling (-3.8%/yr); 1183 active listings in the ZIP; solid renter incomes; 483 units permitted in Waller County in 2024 (89 in 5+ unit buildings).
- Waller County population projected at +62% by 2050 — long-run rental-demand tailwind backs the buy-and-hold thesis.
- 3 sale attempts since 16y ago with the ask held roughly flat each time — persistent listings suggest the price (not the market) is what's stuck; bring a comps-based counter.
- Current owner paid $76k; list at $240k implies a 215% gain — meaningful room to come down on a strong offer.
- Climate carrying-cost: severe wind risk, 98% chance of damaging wind over 30y; major wildfire risk; extreme-heat days projected 7→23/yr by 2055 (HVAC capex compounding) — expect insurance premiums to compound above CPI over the hold.
- Cap rate 6.0% vs local median 2.9% in Todd Mission — top-decile yield for the area; either an underpriced asset or a hidden risk that comps aren't pricing in. Stress-test before assuming the spread holds.
Questions for listing agent
- What do current leases actually rent for vs. the listed asking? Can we see a recent rent roll and the last 12 months of T-12 income?
- Is there a deadline driving the sale (1031 exchange, divorce, estate, relocation)? That informs how much negotiation room exists.
- Schools are F-rated, which usually means shorter tenancies and higher turnover. Who's the typical renter profile here, and what's been the actual vacancy rate?
- The area grade is low — what's the realistic commute time and amenity access for the typical tenant pool here? Any planned neighborhood developments (good or bad) we should know about?
- What's the average days-on-market for RENTAL listings here right now (not sales)? A rising rental-DOM trend means longer vacancies and softer asking-rent achievability than the comps imply.
- What's the recent tenant-quality profile in this submarket — average credit score on applications, eviction rate, late-payment / NSF rate, and stable-employment percentage? A property-management company in the area should have these aggregated.
- How much new for-sale + rental construction is in the pipeline within 1–3 miles? Heavy new supply typically softens prices + rents 12–24 months out; constrained supply supports both.
CashFlowRE · CFR-TWPR4D4P9PFC2X
· Data 2 days ago
cashflowre.app · 2026-05-29