31232 Kyle Dr · Todd Mission, TX
Flood risk 1/10 · Minimal
- FEMA flood zone
- X (unshaded)
- Chance of flooding over 30 yrs
- 0.0%
- Est. flood insurance / yr
- $507 – $1,088
Fire risk 6/10 · Moderate
- Est. fire insurance / yr
- $1,222 – $2,270
Heat risk 8/10 · Major
- Hot days now (above 111°F)
- 7 days/yr
- Hot days in 30 yrs
- 23 days/yr
Wind risk 8/10 · Major
- Chance of severe wind over 30 yrs
- 98.0%
Air-quality risk 2/10 · Minimal
- Unhealthy air days now
- 1 days/yr
- Unhealthy air days in 30 yrs
- 1 days/yr
Risk factors via First Street. Map © Google.
Why this score? — see what drove the D- grade
The composite is a weighted blend of 9 inputs, each scored 0–100. Each bar is that input's sub-score; the figure is the points it added to the 100-point composite (weight × sub-score).
- Cash flow +12.0/30.0
- ARV discount +7.5/15.0
- DSCR +3.6/10.0
- 1% rule +3.4/10.0
- Livability +3.4/5.0
- Appreciation +2.9/10.0
- Schools +2.9/10.0
- Condition / age +2.5/5.0
- Rent growth +1.6/5.0
$240,000
🖨 Deal sheet 📄 Offer letter ✓ Due diligence
Listing remarks MLS
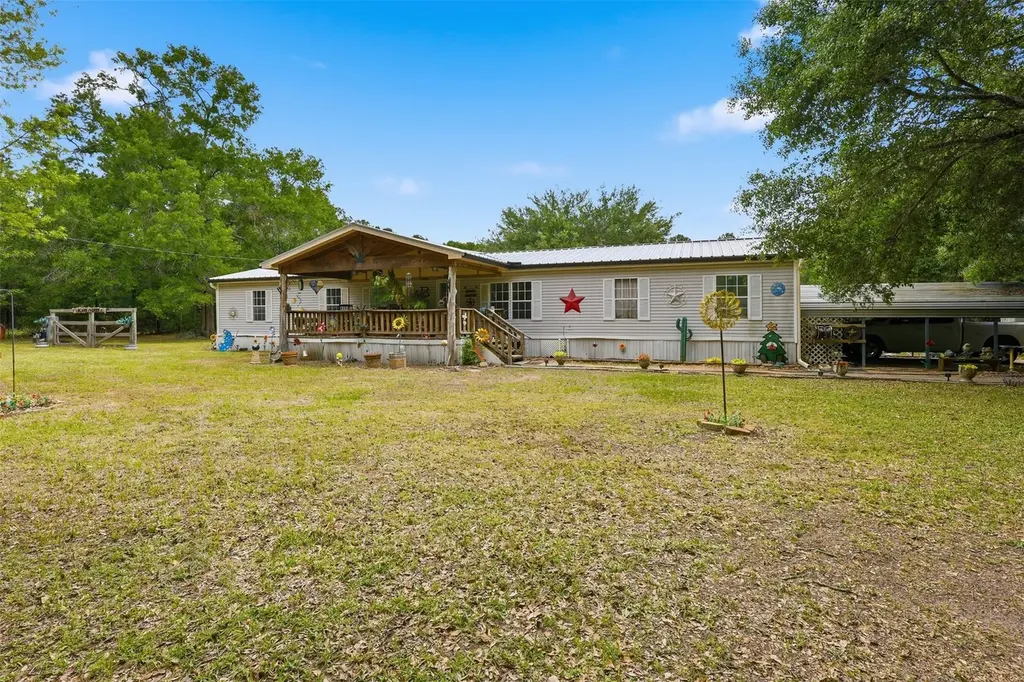
Beautiful 1976 sq ft. Home on 2.56 Acres, Must See to Appreciate, Central Air, Central Heat, Large Open Living and Kitchen Area for Your Family to Enjoy, Extra Storage Areas within Home, Utility Room, Property Fenced and Cross Fenced for Horses, Very Low Tax Rate, Fireplace has circulating fan to heat home, Stocked Pond 17 feet deep with Bass, Channel Cat, and Sun Perch, New Fans on Front Porch, Washer, dryer, freezer, furniture and lots of other furnishing available, Seller downsizing.
Key facts
- Large kitchen
- Cozy fireplace
- Center island
Tags
Property features AI
Finance
- Other: Living area approximately 2,376
- Financial info:
- HOA & community:
Exterior
- Parking:
- Security:
- Utilities: Well water; Septic sewer
- Home design: Residential property; Single-story (entry level: First floor)
- Construction: Built in 1997; Vinyl siding; Wood siding; Metal roof
- Exterior features: Covered patio; Patio; Deck; Wooded lot
Interior
- Kitchen: Dishwasher; Electric range / free-standing range; Oven; Kitchen island
- Bedrooms: Primary bedroom (First floor) — 18 x 12; Bedroom (First floor) — 10 x 13; Bedroom (First floor) — 11 x 10; Bedroom (First floor) — 10 x 12; Up to 4 bedrooms possible
- Flooring: Carpet; Laminate
- Bathrooms: 2 full bathrooms; 1 half bathroom
- Heating & cooling: Central heating (electric); Central air (electric); Thermostat (energy-efficient)
- Interior features: Double vanity; Kitchen island; Primary bathroom with bath in primary bedroom; Soaking tub; Separate shower; Tub/shower combination; Ceiling fans; Living/dining room layout; Programmable thermostat; One fireplace; 10 total rooms
- Laundry & utility: Washer hookup; Electric dryer hookup; Utility room (First floor) — 8 x 7
Neighborhood map
What this means for you Summary
Snapshot
- This is a 4-bed/2.5-bath single-family listed at $240k.
Deal economics
- At list price, monthly cash flow is $-56 ($-668/yr) — negative.
- To cash-flow at today's rent, offer at most $230k (4.1% below list).
- To meet the 1% rule (rent ≥ 1% of price), the offer needs to be $201k (16.4% below list).
- Recommended offer: $201k (16.4% below list) — sets the bar for 1% rule.
- Cap rate 6.0% vs local median 2.9% in Todd Mission — top-decile yield for the area; either an underpriced asset or a hidden risk that comps aren't pricing in. Stress-test before assuming the spread holds.
Location & tenants
- Location reads 67/100 on livability (#549 in TX) — a middle-class / working-renter tenant base. Strengths: employment A+, cost of living A+, housing A+; Watch: amenities F, commute F, health & safety F.
- Waller ISD (rural): math 30% / reading 35% proficiency, ranked #532 of 826 in TX (top 64%) — families likely to look elsewhere, expect single-tenant / working-renter base with shorter leases.
- Zoned schools: Fields Store El (math 47% / reading 43%, grade D-, #1,133 of 4,322 statewide, top 27%, 663 students, 63% FRL); Waller H S (math 25% / reading 40%, grade F, #1,029 of 1,632 statewide, top 64%, 2,639 students, 62% FRL) — zoned schools at 62% FRL track the district average.
- Market conditions: Rents falling (-3.8%/yr); 1183 active listings in the ZIP; solid renter incomes; 483 units permitted in Waller County in 2024 (89 in 5+ unit buildings).
Forward outlook
- Local home prices are declining (-3.0%/yr); year-one equity from $2k of loan paydown is wiped out by about $7k of value loss. Plan a longer hold.
- Waller County population projected at +62% by 2050 — long-run rental-demand tailwind backs the buy-and-hold thesis.
Negotiation context
- It's been on market 23 days — a 2% lower offer ($236k) is reasonable based on typical stale-listing flexibility.
- 3 sale attempts since 16y ago with the ask held roughly flat each time — persistent listings suggest the price (not the market) is what's stuck; bring a comps-based counter.
- Current owner paid $76k; list at $240k implies a 215% gain — meaningful room to come down on a strong offer.
Risks & watch-outs
- Climate carrying-cost: severe wind risk, 98% chance of damaging wind over 30y; major wildfire risk; extreme-heat days projected 7→23/yr by 2055 (HVAC capex compounding) — expect insurance premiums to compound above CPI over the hold.
Questions for the listing agent
- What do current leases actually rent for vs. the listed asking? Can we see a recent rent roll and the last 12 months of T-12 income?
- Is there a deadline driving the sale (1031 exchange, divorce, estate, relocation)? That informs how much negotiation room exists.
- Schools are F-rated, which usually means shorter tenancies and higher turnover. Who's the typical renter profile here, and what's been the actual vacancy rate?
- The area grade is low — what's the realistic commute time and amenity access for the typical tenant pool here? Any planned neighborhood developments (good or bad) we should know about?
- What's the average days-on-market for RENTAL listings here right now (not sales)? A rising rental-DOM trend means longer vacancies and softer asking-rent achievability than the comps imply.
- What's the recent tenant-quality profile in this submarket — average credit score on applications, eviction rate, late-payment / NSF rate, and stable-employment percentage? A property-management company in the area should have these aggregated.
- How much new for-sale + rental construction is in the pipeline within 1–3 miles? Heavy new supply typically softens prices + rents 12–24 months out; constrained supply supports both.
Investment metrics
- 1% rule
- 0.84% ✗
- Cap rate
- 6.01%
- Cash-on-cash
- -0.99%
- DSCR
- 0.96
- GRM
- 10.0
CMA / ARV
- ARV (on-the-fly)
- $624,888
- Comps found
- 4
Show comp detail 4 sales within ~0.75 mi
| Address | Dist | Beds/Ba | Sqft | Sold | Price | $/sf | Match |
|---|---|---|---|---|---|---|---|
| 29231 N Reids Prairie Rd | 0.59mi | 4/3.0 | 2,379 (+0%) | 13mo | $589,000 | $248 | 59 |
| 26600 Carriage Ct | 0.59mi | 3/2.0 (-1) | 2,288 (-4%) | 2mo | $674,900 | $295 | 58 |
| 26036 Spanish Oak Dr | 0.21mi | 4/2.0 | 2,185 (-8%) | 20mo | $575,000 | $263 | 58 |
| 27777 E Stallion Ln | 0.73mi | 3/2.5 (-1) | 2,330 (-2%) | 22mo | $550,000 | $236 | 40 |
Match score weights: distance 35% · size 25% · config 20% · recency 20%. Top-matched comps best support the ARV.
Projected returns pro-forma
-3.0% appreciation · 0.0% rent growth · sell at horizon
- IRR
- -21.3%
- Equity multiple
- 0.28×
- Total profit
- $-48,292
- Equity at exit
- $35,785
- IRR
- -23.9%
- Equity multiple
- -0.03×
- Total profit
- $-69,250
- Equity at exit
- $20,751
Cash invested: $67,200 (down + closing). Projections, not guarantees.
Landlord ↔ Tenant lean methodology
- Overall (STATE)
- 87 Strongly Landlord-Friendly
- State Texas
- 87 Strongly Landlord-Friendly · R+5
- County
- — inherits STATE
- City
- — inherits STATE
ZIP-level market 77484
- Home prices YoY
- -1.0%
- Rents YoY
- -3.8%
- Active inventory
- 1183
- Price-to-rent
- 10.0×
Monthly cashflow live
- Estimated rent
- $2,005 medium interval (Pro) →
- Mortgage (P&I)
- −$1,259
- Tax from tax record
- −$281 /mo · $3,375/yr
- Insurance
- −$100
- HOA
- −$0
- Vacancy / Maint / Mgmt
- −$421
- Net cashflow
- $-56
Break-even live
UW: 25.0% down · 7.5% · 30yr · 1.5% tax · 5.0% vac · 8.0% maint · 8.0% mgmt
Financing live
Cash to close
- Down payment
- $60,000
- Closing costs
- $7,200
- Reserves months
- —
- Total cash needed
- —
Loan-product check · same deal, 3 products live
Conventional
25% down · 7.5% · 30yr
- Down + closing
- —
- Monthly P&I
- —
- Monthly cashflow
- —
- DSCR
- —
- Eligible?
- —
Personal DTI + credit; lowest rate.
DSCR
20% down · 8.5% · 30yr
- Down + closing
- —
- Monthly P&I
- —
- Monthly cashflow
- —
- DSCR
- —
- Eligible?
- —
No personal income docs; deal must DSCR.
Hard money
10% down · 12.0% · 12mo
- Down + closing
- —
- Monthly P&I
- —
- Monthly cashflow
- —
- DSCR
- —
- Eligible?
- —
Short-term bridge; refi at stabilization.
Listing history 20 events
-
2026-06-16days on market $240,000 Pending 23 DOM
-
2026-06-15days on market $240,000 Pending 22 DOM
-
2026-06-13days on market $240,000 Pending 20 DOM
-
2026-06-10status $240,000 Pending 16 DOM
-
2026-06-09days on market $240,000 Active 16 DOM
-
2026-06-08days on market $240,000 Active 15 DOM
-
2026-06-07days on market $240,000 Active 14 DOM
-
2026-06-04days on market $240,000 Active 11 DOM
-
2026-06-03days on market $240,000 Active 10 DOM
-
2026-06-02days on market $240,000 Active 9 DOM
-
2026-06-01days on market $240,000 Active 8 DOM
-
2026-05-31days on market $240,000 Active 7 DOM
-
2026-05-24$240,000 Active
-
2011-03-25soldstatus 491-char remark
Show marketing remark (491 chars)
Beautiful 1976 sq ft. Home on 2.56 Acres, Must See to Appreciate, Central Air, Central Heat, Large Open Living and Kitchen Area for Your Family to Enjoy, Extra Storage Areas within Home, Utility Room, Property Fenced and Cross Fenced for Horses, Very Low Tax Rate, Fireplace has circulating fan to heat home, Stocked Pond 17 feet deep with Bass, Channel Cat, and Sun Perch, New Fans on Front Porch, Washer, dryer, freezer, furniture and lots of other furnishing available, Seller downsizing.
-
2011-03-24soldstatus
-
2011-02-12historical 491-char remark
Show marketing remark (491 chars)
Beautiful 1976 sq ft. Home on 2.56 Acres, Must See to Appreciate, Central Air, Central Heat, Large Open Living and Kitchen Area for Your Family to Enjoy, Extra Storage Areas within Home, Utility Room, Property Fenced and Cross Fenced for Horses, Very Low Tax Rate, Fireplace has circulating fan to heat home, Stocked Pond 17 feet deep with Bass, Channel Cat, and Sun Perch, New Fans on Front Porch, Washer, dryer, freezer, furniture and lots of other furnishing available, Seller downsizing.
-
2011-01-01historical
-
2010-12-31$109,000 491-char remark
Show marketing remark (491 chars)
Beautiful 1976 sq ft. Home on 2.56 Acres, Must See to Appreciate, Central Air, Central Heat, Large Open Living and Kitchen Area for Your Family to Enjoy, Extra Storage Areas within Home, Utility Room, Property Fenced and Cross Fenced for Horses, Very Low Tax Rate, Fireplace has circulating fan to heat home, Stocked Pond 17 feet deep with Bass, Channel Cat, and Sun Perch, New Fans on Front Porch, Washer, dryer, freezer, furniture and lots of other furnishing available, Seller downsizing.
-
2010-09-30$109,000
-
2001-06-01soldstatus $76,300
ⓘ Source: listings_history table (triggers on properties + properties_extension) + one-shot
backfill from property_details.listing_events for pre-trigger history.
Tax reassessment forecast TX · Resets to sale price
- Current annual tax
- $3,375 · $281/mo
- Projected year-2 tax
- $4,392 · $366/mo
- Expected delta
- +$1,017/yr (+$85/mo · 30.1%)
ⓘ Screening estimate from a state-policy table — verify with the county assessor before closing.
Climate risk First Street
- Flood 1/10 Low FEMA zone X (unshaded) · 0% chance over 30 yrs
- Wildfire 6/10 Major
- Heat 8/10 Severe 7 d/yr ≥111°F today · 23 d/yr by 30 yrs out
- Wind 8/10 Severe 98% chance of damaging wind over 30 yrs
- Air quality 2/10 Low 1 unhealthy d/yr today · 1 by 30 yrs out
Nearby sold comps map
Loading sold comps map…
Walkable amenities ~0.75 mi
Loading nearby amenities…
Taxation est. · year 1
- Rental income
- $24,063
- − Mortgage interest
- −$13,444
- − Property taxes
- −$3,375
- − Insurance
- −$1,200
- − Repairs & maintenance
- −$1,925
- − Management
- −$1,925
- − Depreciation
- −$6,982
- Taxable loss
- −$4,787
- Est. tax savings @ 24.0%
- +$1,149
- After-tax cash flow
- $481/yr
For passive investors: Depreciation is non-cash, so a rental often shows a tax loss while cash-flowing — sheltering income. Rental losses are passive: they offset passive income freely, and up to $25,000/yr can offset ordinary (W-2) income if you actively participate and your MAGI is under $100k (phasing out to $0 by $150k); unused losses carry forward. On sale, claimed depreciation is recaptured at up to 25%, and gains may owe capital-gains tax (a 1031 exchange can defer both). Figures are a year-1 estimate at your 24.0% rate — not tax advice; consult a CPA.
Schools (NCES district)
- District
- Waller ISD
- NCES district ID
- 4844430
- Math proficiency
- 30% ▼ -23.00%
- Reading proficiency
- 35% ▼ -11.00%
- Median HH income
- $58,911
- Composite
- 29.12/100
- National rank
- #6593
- State rank
- #532 of 826 in TX
Livability — Todd Mission
- Score
- 67/100
- State rank
- #549
- US rank
- #10627
Category grades
Schools grade is shown separately in the Schools card above.
Census & demographics
- County
- Harris County · 4,702,590 people
- Metro
- Houston-The Woodlands-Sugar Land, TX
- Population (ZIP)
- 14,348
- Household income
- $81,250
- Rent vs Own
- Severe rent burden
- 270.0
Population outlook (Waller County) Hauer SSP2
- Today (2025)
- 60,772 people
- By 2030
- 67,616 · +11.3%
- By 2040
- 82,283 · +35.4%
- By 2050
- 98,276 · +61.7%
- By 2075
- 142,860 · +135.1%
- By 2100
- 175,596 · +188.9%
Race, ethnicity, and origin ACS 2023
- Neighborhood character
- Diverse neighborhood (Simpson 0.66)
- Race & ethnicity
- White 47% Hispanic / Latino 31% Two or more races 16% Black 15%
- Hispanic origin (detail)
- Mexican 30%
- Common ancestry
- Slovak 2% Serbian 2% Iranian 1%
- Foreign-born
- 13% · Canada
- Languages at home
- 73% English-only · Spanish 24% Arabic 2%
Political lean MEDSL · Waller
- 2024 margin
- Strong R (+25.0) · D 37.0% · R 62.0% · Other 1.0%
- 2008→2024 swing
- -17.9pp toward R · 2008: -7.2pp · 2024: -25.0pp
- All cycles
- 2024: R+25.0 2020: R+26.7 2016: R+28.6 2012: R+17.6 2008: R+7.2
Not yet ingested
- Civics
- —
Market trends
- HPI YoY
- ▼ -4.17%
- Current HPI
- 397.85
- Rent YoY
- ▼ -3.77%
- Metro
- Houston-The Woodlands-Sugar Land, TX
- State GDP YoY
- ▲ 3.95%
- F500 in state
- 110
Industry mix (Fortune 500 HQ in TX)
| Industry | F500 HQs | Revenue |
|---|---|---|
| Energy | 16 | $1,198B |
|
||
| Technology | 5 | $198B |
|
||
| Engineering / Construction | 4 | $72B |
|
||
| Energy Services | 3 | $60B |
|
||
| Utilities | 3 | $41B |
|
||
| Healthcare | 2 | $330B |
|
||
Price history
+214.5% since first listed8 events — show timeline
- 2026-05-24 Listed $240,000 HARMLS
- 2011-03-25 Sold (MLS) — HARMLS
- 2011-03-24 Sold (Public Records) — Public Records
- 2011-02-12 Listing Removed — HARMLS
- 2011-01-01 Listing Removed — HARMLS
- 2010-12-31 Listed $109,000 HARMLS
- 2010-09-30 Listed $109,000 HARMLS
- 2001-06-01 Sold (Public Records) $76,300 Public Records
Property tax history
+5.4%/yrLatest (2025): $3,375 · +11.2% YoY. Source: county tax records.
Cash-flow waterfall
monthlySold comps — $/sqft
last 12 mo · ≤1 miLoading sold comps…