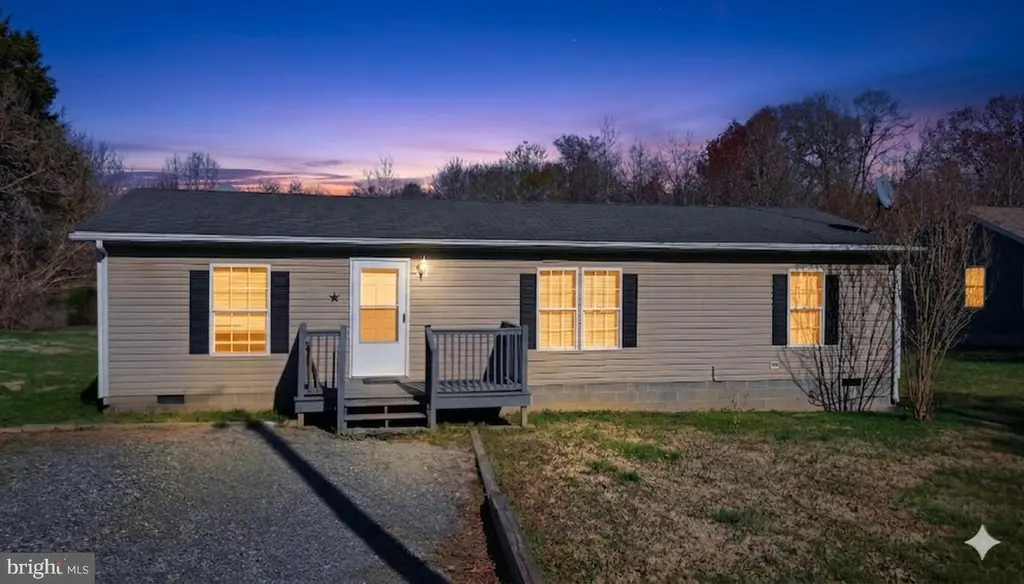
106 Piedmont St
Orange, VA 22960
$239,750D+
3 bd · 2.0 ba ·
1,296 sqft ·
Built 2002
· SingleFamily
· Pending
· 16 DOM
Cashflow @ list (25.0% down · 7.5%)
Estimated rent
$2,049/mo
Mortgage (P&I)
−$1,257
Tax + insurance
−$400
HOA
−$0
Vac / Maint / Mgmt
−$430
Net cashflow
$-38/mo
Annual
$-455/yr
Cap rate
6.10%
Cash-on-cash
-0.68%
DSCR
0.97
1% rule
0.85%
Cash to close
$67,130
Investor read
- This is a 3-bed/2.0-bath single-family listed at $240k.
- At list price, monthly cash flow is $-38 ($-455/yr) — negative.
- To cash-flow at today's rent, offer at most $234k (2.3% below list).
- To meet the 1% rule (rent ≥ 1% of price), the offer needs to be $205k (14.5% below list).
- It's been on market 16 days — a 2% lower offer ($236k) is reasonable based on typical stale-listing flexibility.
- Recommended offer: $205k (14.5% below list) — sets the bar for 1% rule.
- Local home prices are declining (-3.0%/yr); year-one equity from $2k of loan paydown is wiped out by about $7k of value loss. Plan a longer hold.
- Location reads 74/100 on livability (#151 in VA, #4,842 nationally) — a middle-class / working-renter tenant base. Strengths: health & safety A+, housing A, cost of living A-; Watch: crime C-, employment D+, amenities D.
- Orange County Public School District (rural): math 47% / reading 64% proficiency, ranked #71 of 131 in VA (top 54%) — acceptable for families but not a draw, mixed tenant base, ~2y average lease.
- Zoned schools: Gordon-Barbour Elementary (math 52% / reading 62%, grade C+, #597 of 1,108 statewide, top 57%, 321 students, 70% FRL); Prospect Heights Middle (math 43% / reading 63%, grade C+, #213 of 342 statewide, top 63%, 456 students, 68% FRL); Orange County High (math 61% / reading 72%, grade B, #195 of 319 statewide, top 62%, 1,476 students, 43% FRL) — zoned schools average 60% FRL vs 34% district-wide (27 pts higher); higher-poverty schools than district average — tighter screening recommended.
- Market conditions: 127 active listings in the ZIP; 3 comparable units currently listed for rent nearby; rentals leasing fast (median 1d on market — plan ~1-2 weeks tenant-placement turnaround); 412 units permitted in Orange County in 2024 (0 in 5+ unit buildings).
- Orange County population projected at +18% by 2050 — long-run rental-demand tailwind backs the buy-and-hold thesis.
- Cap rate 6.1% vs local median 4.0% in Orange — top-decile yield for the area; either an underpriced asset or a hidden risk that comps aren't pricing in. Stress-test before assuming the spread holds.
Questions for listing agent
- What do current leases actually rent for vs. the listed asking? Can we see a recent rent roll and the last 12 months of T-12 income?
- Is there a deadline driving the sale (1031 exchange, divorce, estate, relocation)? That informs how much negotiation room exists.
- Schools are B-rated — typically a magnet for longer-tenancy family renters. What's the average tenant stay here, and is there a school-zone premium baked into asking?
- The area grade is low — what's the realistic commute time and amenity access for the typical tenant pool here? Any planned neighborhood developments (good or bad) we should know about?
- What's the average days-on-market for RENTAL listings here right now (not sales)? A rising rental-DOM trend means longer vacancies and softer asking-rent achievability than the comps imply.
- What's the recent tenant-quality profile in this submarket — average credit score on applications, eviction rate, late-payment / NSF rate, and stable-employment percentage? A property-management company in the area should have these aggregated.
- How much new for-sale + rental construction is in the pipeline within 1–3 miles? Heavy new supply typically softens prices + rents 12–24 months out; constrained supply supports both.
CashFlowRE · CFR-TZ05QJ0ECVT1XJ
· Data 4 weeks ago
cashflowre.app · 2026-05-29