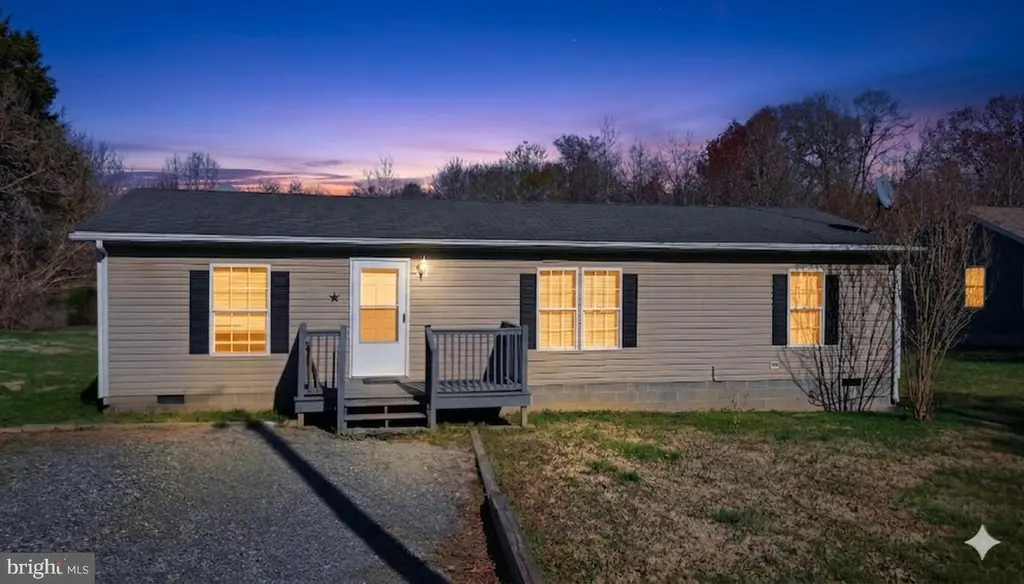
106 Piedmont St · Orange, VA
Flood risk No data
- FEMA flood zone
- —
- Chance of flooding over 30 yrs
- —
- Est. flood insurance / yr
- —
Fire risk No data
- Est. fire insurance / yr
- —
Heat risk No data
- Hot days now (above threshold)
- —
- Hot days in 30 yrs
- —
Wind risk No data
- Chance of severe wind over 30 yrs
- —
Air-quality risk No data
- Unhealthy air days now
- —
- Unhealthy air days in 30 yrs
- —
Risk factors via First Street. Map © Google.
Why this score? — see what drove the D+ grade
The composite is a weighted blend of 9 inputs, each scored 0–100. Each bar is that input's sub-score; the figure is the points it added to the 100-point composite (weight × sub-score).
- ARV discount +15.0/15.0
- Cash flow +12.4/30.0
- Schools +4.8/10.0
- DSCR +3.7/10.0
- Livability +3.7/5.0
- 1% rule +3.5/10.0
- Rent growth +2.5/5.0
- Condition / age +2.5/5.0
- Appreciation +0.7/10.0
$239,750
🖨 Deal sheet (PDF) 📄 Offer letter ✓ Due diligence
Listing remarks
Located in the heart of Gordonsville, this beautifully updated three-bedroom, two-bathroom home offers the perfect blend of modern comfort and small-town convenience. The residence is within easy walking distance to the quaint town center, providing quick access to local shopping, dining, and parks, while the community pool, playground, and picnic shelter are located just a block away. Inside, the home has been meticulously refreshed with brand-new paint throughout, new carpeting, and updated flooring in the kitchen. The kitchen is equipped with a new microwave and nearly new appliances, including the refrigerator, washer, and dryer. The primary suite serves as a private retreat, featuring
Key facts
- 0.67 acre lot
- 4 parking spots
- Built 2002
Property features AI
Finance
- Other: 2+ access exits (accessibility feature)
Exterior
- Parking: Driveway parking (4 spaces); Total of 4 garage/parking spaces
- Utilities: Public water available; Public sewer available; Electric available
- Home design: Manufactured double-wide; Fee simple ownership; Shingle roof
- Construction: Vinyl siding; Above-grade and below-grade structures; Year built source: Assessor
- Exterior features: Gutter system; Outbuilding(s); Play area; Play equipment; Porches; Patios; Public road access (paved)
Interior
- Kitchen: Built-in microwave; Built-in range; Dishwasher; Refrigerator
- Bedrooms: Three bedrooms on the main level
- Flooring: Carpet; Luxury vinyl plank
- Bathrooms: Two full bathrooms (main level)
- Heating & cooling: Heat pump(s); Central air (electric cooling); Electric heating fuel; Electric hot water
- Interior features: Soaking tub; Tub with shower; Stall shower; Dining area; Master bathroom; Recessed lighting; Window treatments; Storm door(s)
- Laundry & utility: Main-floor laundry; Washer; Dryer (electric); Water heater (electric)
Neighborhood map
What this means for you Summary
Snapshot
- This is a 3-bed/2.0-bath single-family listed at $240k.
Deal economics
- At list price, monthly cash flow is $-38 ($-455/yr) — negative.
- To cash-flow at today's rent, offer at most $234k (2.3% below list).
- To meet the 1% rule (rent ≥ 1% of price), the offer needs to be $205k (14.5% below list).
- Recommended offer: $205k (14.5% below list) — sets the bar for 1% rule.
- Cap rate 6.1% vs local median 4.0% in Orange — top-decile yield for the area; either an underpriced asset or a hidden risk that comps aren't pricing in. Stress-test before assuming the spread holds.
Location & tenants
- Location reads 74/100 on livability (#151 in VA, #4,842 nationally) — a middle-class / working-renter tenant base. Strengths: health & safety A+, housing A, cost of living A-; Watch: crime C-, employment D+, amenities D.
- Orange County Public School District (rural): math 47% / reading 64% proficiency, ranked #71 of 131 in VA (top 54%) — acceptable for families but not a draw, mixed tenant base, ~2y average lease.
- Zoned schools: Gordon-Barbour Elementary (math 52% / reading 62%, grade C+, #597 of 1,108 statewide, top 57%, 321 students, 70% FRL); Prospect Heights Middle (math 43% / reading 63%, grade C+, #213 of 342 statewide, top 63%, 456 students, 68% FRL); Orange County High (math 61% / reading 72%, grade B, #195 of 319 statewide, top 62%, 1,476 students, 43% FRL) — zoned schools average 60% FRL vs 34% district-wide (27 pts higher); higher-poverty schools than district average — tighter screening recommended.
- Market conditions: 127 active listings in the ZIP; 3 comparable units currently listed for rent nearby; rentals leasing fast (median 0d on market — plan ~1-2 weeks tenant-placement turnaround); 412 units permitted in Orange County in 2024 (0 in 5+ unit buildings).
Forward outlook
- Local home prices are declining (-3.0%/yr); year-one equity from $2k of loan paydown is wiped out by about $7k of value loss. Plan a longer hold.
- Orange County population projected at +18% by 2050 — long-run rental-demand tailwind backs the buy-and-hold thesis.
Negotiation context
- It's been on market 16 days — a 2% lower offer ($236k) is reasonable based on typical stale-listing flexibility.
Questions for the listing agent
- What do current leases actually rent for vs. the listed asking? Can we see a recent rent roll and the last 12 months of T-12 income?
- Is there a deadline driving the sale (1031 exchange, divorce, estate, relocation)? That informs how much negotiation room exists.
- Schools are B-rated — typically a magnet for longer-tenancy family renters. What's the average tenant stay here, and is there a school-zone premium baked into asking?
- The area grade is low — what's the realistic commute time and amenity access for the typical tenant pool here? Any planned neighborhood developments (good or bad) we should know about?
- What's the average days-on-market for RENTAL listings here right now (not sales)? A rising rental-DOM trend means longer vacancies and softer asking-rent achievability than the comps imply.
- What's the recent tenant-quality profile in this submarket — average credit score on applications, eviction rate, late-payment / NSF rate, and stable-employment percentage? A property-management company in the area should have these aggregated.
- How much new for-sale + rental construction is in the pipeline within 1–3 miles? Heavy new supply typically softens prices + rents 12–24 months out; constrained supply supports both.
Investment metrics
- 1% rule
- 0.85% ✗
- Cap rate
- 6.10%
- Cash-on-cash
- -0.68%
- DSCR
- 0.97
- GRM
- 9.7
CMA / ARV
- ARV (on-the-fly)
- $294,192
- Comps found
- 10
Show comp detail 10 sales within ~0.75 mi
| Address | Dist | Beds/Ba | Sqft | Sold | Price | $/sf | Match |
|---|---|---|---|---|---|---|---|
| 106 Piedmont St | 0.00mi | 3/2.0 | 1,296 (0%) | 1mo | $228,000 | $176 | 99 |
| 147 S Almond St | 0.08mi | 3/2.0 | 1,328 (+2%) | 11mo | $269,000 | $203 | 83 |
| 220 S Blue Ridge Dr | 0.18mi | 4/2.0 (+1) | 1,200 (-7%) | 10mo | $330,000 | $275 | 66 |
| 312 Jefferson St | 0.25mi | 3/2.0 | 1,154 (-11%) | 6mo | $299,000 | $259 | 65 |
| 234 Landon Ln | 0.51mi | 3/2.0 | 1,400 (+8%) | 1mo | $298,000 | $213 | 62 |
| 198 Burgess St | 0.32mi | 2/1.0 (-1) | 1,200 (-7%) | 5mo | $272,700 | $227 | 60 |
| 16086 Monrovia Rd | 0.46mi | 3/1.0 | 1,162 (-10%) | 10mo | $220,000 | $189 | 50 |
| 199 Peliso Ave | 0.57mi | 4/2.0 (+1) | 1,192 (-8%) | 9mo | $310,000 | $260 | 47 |
| 362 Williams Dr | 0.41mi | 3/1.5 | 1,130 (-13%) | 14mo | $310,000 | $274 | 46 |
| 112 Grasty St | 0.25mi | 4/1.0 (+1) | 1,142 (-12%) | 21mo | $249,000 | $218 | 42 |
Match score weights: distance 35% · size 25% · config 20% · recency 20%. Top-matched comps best support the ARV.
Projected returns pro-forma
-3.0% appreciation · 3.0% rent growth · sell at horizon
- IRR
- -17.4%
- Equity multiple
- 0.39×
- Total profit
- $-41,233
- Equity at exit
- $35,748
- IRR
- -9.4%
- Equity multiple
- 0.42×
- Total profit
- $-38,889
- Equity at exit
- $20,729
Cash invested: $67,130 (down + closing). Projections, not guarantees.
Landlord ↔ Tenant lean methodology
- Overall (STATE)
- 55 Moderately Landlord-Leaning
- State Virginia
- 55 Moderately Landlord-Leaning · D+2
- County
- — inherits STATE
- City
- — inherits STATE
ZIP-level market 22960
- Home prices YoY
- -2.4%
- Active inventory
- 127
- Price-to-rent
- 9.7×
Monthly cashflow live
- Estimated rent
- $2,049 medium interval (Pro) →
- Mortgage (P&I)
- −$1,257
- Tax est. 1.5%
- −$300 /mo · $3,596/yr
- Insurance
- −$100
- HOA
- −$0
- Vacancy / Maint / Mgmt
- −$430
- Net cashflow
- $-38
Break-even live
Sensitivity live
| Price | -10% $128 | -5% $45 | +0% $-38 | +5% $-121 | +10% $-204 |
|---|---|---|---|---|---|
| Rent | -10% $-200 | -5% $-119 | +0% $-38 | +5% $43 | +10% $124 |
| Rate | -1.0pp $83 | -0.5pp $23 | base $-38 | +0.5pp $-100 | +1.0pp $-163 |
UW: 25.0% down · 7.5% · 30yr · 1.5% tax · 5.0% vac · 8.0% maint · 8.0% mgmt
Financing live
Cash to close
- Down payment
- $59,938
- Closing costs
- $7,192
- Reserves months
- —
- Total cash needed
- —
Loan-product check · same deal, 3 products live
Conventional
25% down · 7.5% · 30yr
- Down + closing
- —
- Monthly P&I
- —
- Monthly cashflow
- —
- DSCR
- —
- Eligible?
- —
Personal DTI + credit; lowest rate.
DSCR
20% down · 8.5% · 30yr
- Down + closing
- —
- Monthly P&I
- —
- Monthly cashflow
- —
- DSCR
- —
- Eligible?
- —
No personal income docs; deal must DSCR.
Hard money
10% down · 12.0% · 12mo
- Down + closing
- —
- Monthly P&I
- —
- Monthly cashflow
- —
- DSCR
- —
- Eligible?
- —
Short-term bridge; refi at stabilization.
Rent comps 3 comps
| Address | Beds | Baths | Sqft | Rent | $/sqft | DOM | Units | Dist |
|---|---|---|---|---|---|---|---|---|
| 191 Barbour St Orange, VA | 3.0 | 2.0 | 1722 | $2,000 | $1.16 | 0d | 1 | 0.30mi |
| 109 Oakbrook Dr Orange, VA | 2.0–3.0 | 2.0 | 963 | $1,586 | $1.65 | 0d | 1 | 1.17mi |
| 615 Clover Ln Orange, VA | 4.0 | 2.0 | 1790 | $2,850 | $1.59 | 7d | 1 | 1.39mi |
Listing history 4 events
-
2026-05-15status Pending
-
2026-04-23historical Active Under Contract
-
2026-04-08$239,750 Active
-
2026-04-01historical $239,750
ⓘ Source: listings_history table (triggers on properties + properties_extension) + one-shot
backfill from property_details.listing_events for pre-trigger history.
Nearby sold comps map
Loading sold comps map…
Walkable amenities ~0.75 mi
Loading nearby amenities…
Taxation est. · year 1
- Rental income
- $24,592
- − Mortgage interest
- −$13,430
- − Property taxes
- −$3,596
- − Insurance
- −$1,199
- − Repairs & maintenance
- −$1,967
- − Management
- −$1,967
- − Depreciation
- −$6,975
- Taxable loss
- −$4,542
- Est. tax savings @ 24.0%
- +$1,090
- After-tax cash flow
- $635/yr
For passive investors: Depreciation is non-cash, so a rental often shows a tax loss while cash-flowing — sheltering income. Rental losses are passive: they offset passive income freely, and up to $25,000/yr can offset ordinary (W-2) income if you actively participate and your MAGI is under $100k (phasing out to $0 by $150k); unused losses carry forward. On sale, claimed depreciation is recaptured at up to 25%, and gains may owe capital-gains tax (a 1031 exchange can defer both). Figures are a year-1 estimate at your 24.0% rate — not tax advice; consult a CPA.
Schools (NCES district)
- District
- Orange County Public School District
- NCES district ID
- 5102820
- Math proficiency
- 47% ▼ -35.00%
- Reading proficiency
- 64% ▼ -14.00%
- Median HH income
- $61,086
- Composite
- 48.34/100
- National rank
- #2147
- State rank
- #71 of 131 in VA
Livability — Orange
- Score
- 74/100
- State rank
- #151
- US rank
- #4842
Category grades
Schools grade is shown separately in the Schools card above.
Census & demographics
- Census place
- Orange, VA
- Population (ZIP)
- 10,877
Population outlook (Orange County) Hauer SSP2
- Today (2025)
- 38,758 people
- By 2030
- 40,411 · +4.3%
- By 2040
- 43,477 · +12.2%
- By 2050
- 45,856 · +18.3%
- By 2075
- 51,067 · +31.8%
- By 2100
- 51,387 · +32.6%
Race, ethnicity, and origin ACS 2023
- Neighborhood character
- Predominantly White (76%)
- Race & ethnicity
- White 76% Black 17% Two or more races 4% Hispanic / Latino 4%
- Common ancestry
- Portuguese 3% Lithuanian 1% Italian 1%
- Foreign-born
- 2% · Canada
- Languages at home
- 95% English-only · Spanish 3% German/W. Germanic 1% Other Indo-European 1%
Political lean MEDSL · Orange
- 2024 margin
- Strong R (+24.7) · D 37.2% · R 61.9%
- 2008→2024 swing
- -15.8pp toward R · 2008: -8.8pp · 2024: -24.7pp
- All cycles
- 2024: R+24.7 2020: R+21.4 2016: R+26.6 2012: R+14.5 2008: R+8.8
Not yet ingested
- Civics
- —
Market trends
- HPI YoY
- ▼ -8.60%
- Current HPI
- 350.4024
- Rent YoY
- —
- Metro
- —
- State GDP YoY
- ▲ 2.40%
- F500 in state
- 50
Industry mix (Fortune 500 HQ in VA)
| Industry | F500 HQs | Revenue |
|---|---|---|
| Aerospace / Defense | 4 | $236B |
|
||
| Technology / Defense | 3 | $32B |
|
||
| Financial Services | 2 | $176B |
|
||
| Utilities | 2 | $27B |
|
||
| Insurance | 2 | $25B |
|
||
| Technology | 2 | $15B |
|
||
Price history
+0.0% since first listed4 events — show timeline
- 2026-05-15 Pending — BRIGHT MLS
- 2026-04-23 Contingent — BRIGHT MLS
- 2026-04-08 Listed $239,750 BRIGHT MLS
- 2026-04-01 Coming Soon $239,750 BRIGHT MLS
Cash-flow waterfall
monthlySold comps — $/sqft
last 12 mo · ≤1 miLoading sold comps…