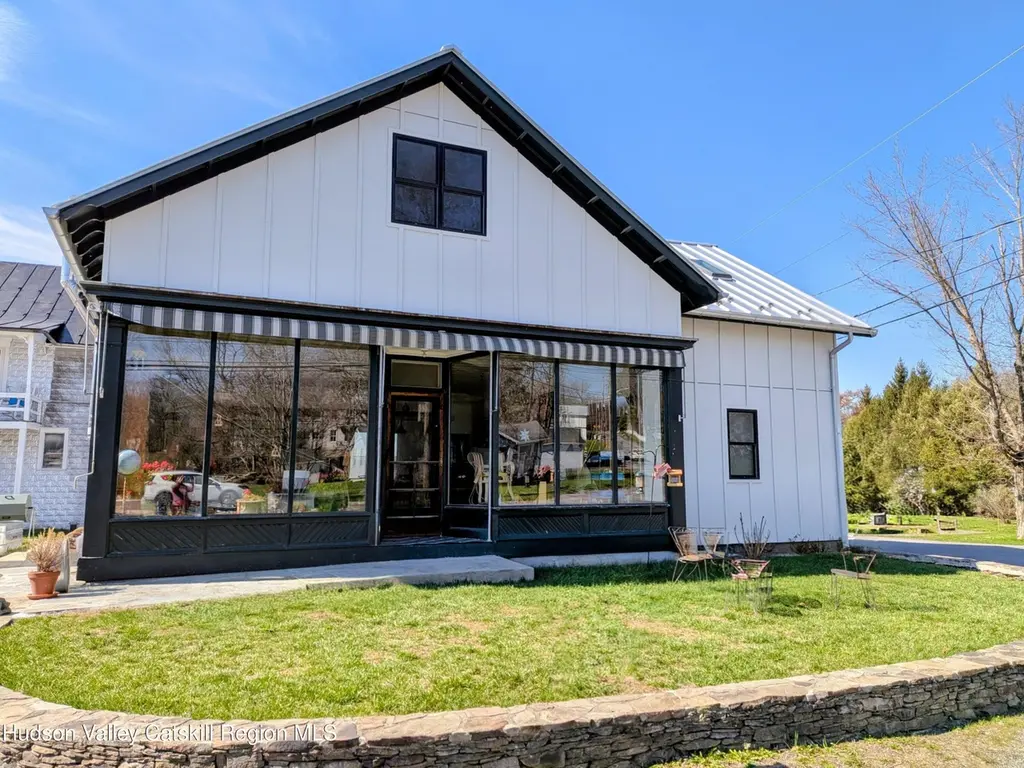
116 County Route 19
Claverack-Red Mills, NY 12534
$475,000D+
3 bd · 1.0 ba ·
1,663 sqft ·
Built 1920
· SingleFamily
· Pending
· 48 DOM
Cashflow @ list (25.0% down · 7.5%)
Estimated rent
$2,627/mo
Mortgage (P&I)
−$2,491
Tax + insurance
−$440
HOA
−$0
Vac / Maint / Mgmt
−$552
Net cashflow
$-855/mo
Annual
$-10,264/yr
Cap rate
4.13%
Cash-on-cash
-7.72%
DSCR
0.66
1% rule
0.55%
Cash to close
$133,000
Investor read
- This is a 3-bed/1.0-bath single-family listed at $475k.
- At list price, monthly cash flow is $-855 ($-10k/yr) — negative.
- To cash-flow at today's rent, offer at most $324k (31.8% below list).
- To meet the 1% rule (rent ≥ 1% of price), the offer needs to be $263k (44.7% below list).
- It's been on market 48 days — a 3% lower offer ($461k) is reasonable based on typical stale-listing flexibility.
- Recommended offer: $263k (44.7% below list) — sets the bar for 1% rule.
- In year one you build about $51k of equity ($3k loan paydown + $48k appreciation (10.0% local appreciation)).
- Location reads: area grade D — affects rentability + tenant quality, not the cash-flow math above.
- Hudson City School District (town): math 38% / reading 47% proficiency, ranked #494 of 590 in NY (top 84%) — families likely to look elsewhere, expect single-tenant / working-renter base with shorter leases.
- Zoned schools: Montgomery C Smith Elementary School (math 36% / reading 47%, grade F, #1,409 of 2,108 statewide, top 67%, 723 students, 65% FRL); Hudson Junior High School (math 20% / reading 36%, grade F, #573 of 729 statewide, top 79%, 384 students, 63% FRL); Hudson High School (math 82% / reading 84%, grade A, #435 of 1,100 statewide, top 40%, 454 students, 57% FRL).
- Watch-outs: built in 1920 — expect roof / HVAC / electrical / plumbing capex.
- Market conditions: Rents rising fast (+10.9%/yr); 162 active listings in the ZIP; 136 units permitted in Columbia County in 2024 (0 in 5+ unit buildings).
- Columbia County population projected at -22% by 2050 — secular population decline; favor cash flow + early exit over multi-decade hold.
- 4 sale attempts since 6y ago with the ask held roughly flat each time — persistent listings suggest the price (not the market) is what's stuck; bring a comps-based counter.
- By year 2, paydown + projected appreciation supports a ~$82k cash-out refi (75% LTV) — recoverable capital for the next deal without selling this one.
- This rent runs 43% of the median local income ($73k/yr) — at the standard rent-burdened threshold; future hikes will face affordability resistance.
Questions for listing agent
- What do current leases actually rent for vs. the listed asking? Can we see a recent rent roll and the last 12 months of T-12 income?
- It's been on market 48 days. Have you received any prior offers? Is the seller open to a 45% concession, seller financing, or rate buy-down credit?
- Built in 1920 — when were the roof, HVAC, electrical panel, plumbing, and water heater last replaced?
- Is there a deadline driving the sale (1031 exchange, divorce, estate, relocation)? That informs how much negotiation room exists.
- The area grade is low — what's the realistic commute time and amenity access for the typical tenant pool here? Any planned neighborhood developments (good or bad) we should know about?
- What's the average days-on-market for RENTAL listings here right now (not sales)? A rising rental-DOM trend means longer vacancies and softer asking-rent achievability than the comps imply.
- What's the recent tenant-quality profile in this submarket — average credit score on applications, eviction rate, late-payment / NSF rate, and stable-employment percentage? A property-management company in the area should have these aggregated.
- How much new for-sale + rental construction is in the pipeline within 1–3 miles? Heavy new supply typically softens prices + rents 12–24 months out; constrained supply supports both.
CashFlowRE · CFR-TZKWHCBCF388JP
· Data 1 week ago
cashflowre.app · 2026-05-29