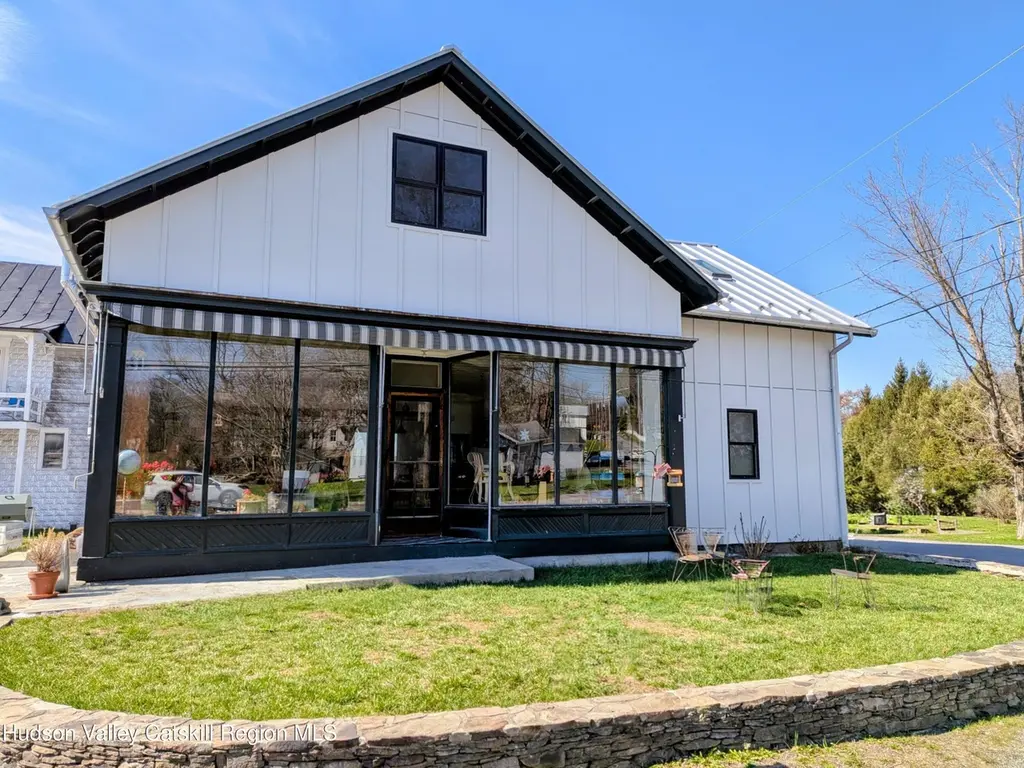
116 County Route 19 · Claverack-Red Mills, NY
Flood risk 1/10 · Minimal
- FEMA flood zone
- X
- Chance of flooding over 30 yrs
- 0.0%
- Est. flood insurance / yr
- $473 – $860
Fire risk 3/10 · Minor
- Est. fire insurance / yr
- $691 – $1,283
Heat risk 4/10 · Minor
- Hot days now (above 97°F)
- 7 days/yr
- Hot days in 30 yrs
- 15 days/yr
Wind risk 3/10 · Minor
- Chance of severe wind over 30 yrs
- 8.0%
Air-quality risk 2/10 · Minimal
- Unhealthy air days now
- 1 days/yr
- Unhealthy air days in 30 yrs
- 2 days/yr
Risk factors via First Street. Map © Google.
Why this score? — see what drove the D+ grade
The composite is a weighted blend of 9 inputs, each scored 0–100. Each bar is that input's sub-score; the figure is the points it added to the 100-point composite (weight × sub-score).
- ARV discount +15.0/15.0
- Appreciation +10.0/10.0
- Cash flow +6.2/30.0
- Rent growth +5.0/5.0
- Schools +3.6/10.0
- Livability +2.5/5.0
- Condition / age +2.5/5.0
- DSCR +0.6/10.0
- 1% rule +0.5/10.0
$475,000
🖨 Deal sheet (PDF) 📄 Offer letter ✓ Due diligence
Listing remarks
Own a piece of history. This captivating house, once the bustling Livingston General store, built by Gilbert Lynk in the 1920s, boasts an incredible open floor plan that invites creativity and comfort. With a perfect blend of period details and contemporary flair, this unique property offers an unparalleled lifestyle opportunity for artists, entrepreneurs, or anyone seeking a one-of-a-kind residence. It was reimaged as a book store and then as a lovely personal residence. Step back in time and enjoy the historic charm and original architectural details that tell the story of its rich past. The expansive layout creates a seamless flow between living spaces and natural light floods the interi
Key facts
- Open floor plan
- Artist loft area
- Historic charm
Tags
Property features AI
Finance
- HOA & community: Community park; Playground; Street lights; Tennis courts
Exterior
- Parking: On-site parking
- Utilities: Private well water; Aerobic septic system; 200+ amp electric service
- Home design: Single-family residence; Residential property; Has a view
- Construction: Board & batten siding with frame construction; Metal roof; Concrete perimeter foundation; Approximately 2,500 above-grade finished square footage
- Exterior features: Awning(s); Shed(s); Corner, level lot; County road frontage; Asphalt road
Interior
- Kitchen: Range; Dishwasher; Refrigerator
- Bedrooms: Master bedroom located downstairs
- Flooring: Hardwood floors; Tile floors
- Bathrooms: 2 full bathrooms
- Heating & cooling: Forced air heating; Propane heating; Wood stove; Central air conditioning; Ceiling fans
- Interior features: Breakfast bar; Built-in features; Ceiling fans; High-speed internet; Open floor plan; Master bedroom on main level; Full, unfinished basement
- Laundry & utility: Washer and dryer included; Laundry on main level
Neighborhood map
What this means for you Summary
Snapshot
- This is a 3-bed/1.0-bath single-family listed at $475k.
Deal economics
- At list price, monthly cash flow is $-855 ($-10k/yr) — negative.
- To cash-flow at today's rent, offer at most $324k (31.8% below list).
- To meet the 1% rule (rent ≥ 1% of price), the offer needs to be $263k (44.7% below list).
- Recommended offer: $263k (44.7% below list) — sets the bar for 1% rule.
Location & tenants
- Location reads: area grade D — affects rentability + tenant quality, not the cash-flow math above.
- Hudson City School District (town): math 38% / reading 47% proficiency, ranked #494 of 590 in NY (top 84%) — families likely to look elsewhere, expect single-tenant / working-renter base with shorter leases.
- Zoned schools: Montgomery C Smith Elementary School (math 36% / reading 47%, grade F, #1,409 of 2,108 statewide, top 67%, 723 students, 65% FRL); Hudson Junior High School (math 20% / reading 36%, grade F, #573 of 729 statewide, top 79%, 384 students, 63% FRL); Hudson High School (math 82% / reading 84%, grade A, #435 of 1,100 statewide, top 40%, 454 students, 57% FRL).
- Market conditions: Rents rising fast (+10.9%/yr); 162 active listings in the ZIP; 136 units permitted in Columbia County in 2024 (0 in 5+ unit buildings).
- This rent runs 43% of the median local income ($73k/yr) — at the standard rent-burdened threshold; future hikes will face affordability resistance.
Forward outlook
- In year one you build about $51k of equity ($3k loan paydown + $48k appreciation (10.0% local appreciation)).
- Columbia County population projected at -22% by 2050 — secular population decline; favor cash flow + early exit over multi-decade hold.
- By year 2, paydown + projected appreciation supports a ~$82k cash-out refi (75% LTV) — recoverable capital for the next deal without selling this one.
Negotiation context
- It's been on market 48 days — a 3% lower offer ($461k) is reasonable based on typical stale-listing flexibility.
- 4 sale attempts since 6y ago with the ask held roughly flat each time — persistent listings suggest the price (not the market) is what's stuck; bring a comps-based counter.
Risks & watch-outs
- Watch-outs: built in 1920 — expect roof / HVAC / electrical / plumbing capex.
Questions for the listing agent
- What do current leases actually rent for vs. the listed asking? Can we see a recent rent roll and the last 12 months of T-12 income?
- It's been on market 48 days. Have you received any prior offers? Is the seller open to a 45% concession, seller financing, or rate buy-down credit?
- Built in 1920 — when were the roof, HVAC, electrical panel, plumbing, and water heater last replaced?
- Is there a deadline driving the sale (1031 exchange, divorce, estate, relocation)? That informs how much negotiation room exists.
- The area grade is low — what's the realistic commute time and amenity access for the typical tenant pool here? Any planned neighborhood developments (good or bad) we should know about?
- What's the average days-on-market for RENTAL listings here right now (not sales)? A rising rental-DOM trend means longer vacancies and softer asking-rent achievability than the comps imply.
- What's the recent tenant-quality profile in this submarket — average credit score on applications, eviction rate, late-payment / NSF rate, and stable-employment percentage? A property-management company in the area should have these aggregated.
- How much new for-sale + rental construction is in the pipeline within 1–3 miles? Heavy new supply typically softens prices + rents 12–24 months out; constrained supply supports both.
Investment metrics
- 1% rule
- 0.55% ✗
- Cap rate
- 4.13%
- Cash-on-cash
- -7.72%
- DSCR
- 0.66
- GRM
- 15.1
CMA / ARV
- ARV (median comp)
- $594,006
- List price
- $475,000
- Delta
- -20.03%
- Verdict
- UNDERPRICED
- Comps
- 8 within 1.0 mi
Show comp detail 1 sale within ~0.75 mi
| Address | Dist | Beds/Ba | Sqft | Sold | Price | $/sf | Match |
|---|---|---|---|---|---|---|---|
| 524 - Stop 13 Church Rd | 0.62mi | 3/2.0 | 1,566 (-6%) | 13mo | $470,000 | $300 | 46 |
Match score weights: distance 35% · size 25% · config 20% · recency 20%. Top-matched comps best support the ARV.
Projected returns pro-forma
10.0% appreciation · 8.0% rent growth · sell at horizon
- IRR
- 19.9%
- Equity multiple
- 2.64×
- Total profit
- $217,927
- Equity at exit
- $427,918
- IRR
- 19.2%
- Equity multiple
- 6.40×
- Total profit
- $718,644
- Equity at exit
- $922,821
Cash invested: $133,000 (down + closing). Projections, not guarantees.
Landlord ↔ Tenant lean methodology
- Overall (STATE)
- 15 Strongly Tenant-Friendly
- State New York
- 15 Strongly Tenant-Friendly · D+10
- County
- — inherits STATE
- City
- — inherits STATE
ZIP-level market 12534
- Home prices YoY
- 5.6%
- Rents YoY
- 10.9%
- Active inventory
- 162
- Price-to-rent
- 15.1×
Monthly cashflow live
- Estimated rent
- $2,627 medium interval (Pro) →
- Mortgage (P&I)
- −$2,491
- Tax from tax record
- −$242 /mo · $2,903/yr
- Insurance
- −$198
- HOA
- −$0
- Vacancy / Maint / Mgmt
- −$552
- Net cashflow
- $-855
Break-even live
Sensitivity live
| Price | -10% $-586 | -5% $-721 | +0% $-855 | +5% $-990 | +10% $-1,124 |
|---|---|---|---|---|---|
| Rent | -10% $-1,063 | -5% $-959 | +0% $-855 | +5% $-752 | +10% $-648 |
| Rate | -1.0pp $-616 | -0.5pp $-735 | base $-855 | +0.5pp $-978 | +1.0pp $-1,104 |
UW: 25.0% down · 7.5% · 30yr · 1.5% tax · 5.0% vac · 8.0% maint · 8.0% mgmt
Financing live
Cash to close
- Down payment
- $118,750
- Closing costs
- $14,250
- Reserves months
- —
- Total cash needed
- —
Loan-product check · same deal, 3 products live
Conventional
25% down · 7.5% · 30yr
- Down + closing
- —
- Monthly P&I
- —
- Monthly cashflow
- —
- DSCR
- —
- Eligible?
- —
Personal DTI + credit; lowest rate.
DSCR
20% down · 8.5% · 30yr
- Down + closing
- —
- Monthly P&I
- —
- Monthly cashflow
- —
- DSCR
- —
- Eligible?
- —
No personal income docs; deal must DSCR.
Hard money
10% down · 12.0% · 12mo
- Down + closing
- —
- Monthly P&I
- —
- Monthly cashflow
- —
- DSCR
- —
- Eligible?
- —
Short-term bridge; refi at stabilization.
Listing history 14 events
-
2026-06-12statusdays on market $475,000 Pending 48 DOM
-
2026-06-09days on market $475,000 Active Under Contract 47 DOM
-
2026-06-08days on market $475,000 Active Under Contract 46 DOM
-
2026-06-07days on market $475,000 Active Under Contract 45 DOM
-
2026-06-04days on market $475,000 Active Under Contract 41 DOM
-
2026-06-02days on market $475,000 Active Under Contract 40 DOM
-
2026-06-01days on market $475,000 Active Under Contract 39 DOM
-
2026-05-31days on market $475,000 Active Under Contract 38 DOM
-
2026-05-31days on market $475,000 Active Under Contract 37 DOM
-
2026-05-11historical Active Under Contract 1480-char remark
-
2026-04-23$475,000 Active 1480-char remark
-
2020-12-21$510,000
-
2020-07-26$510,000
-
2020-06-18$625,000
ⓘ Source: listings_history table (triggers on properties + properties_extension) + one-shot
backfill from property_details.listing_events for pre-trigger history.
Tax reassessment forecast NY · Partial reset (capped growth)
- Current annual tax
- $2,903 · $242/mo
- Projected year-2 tax
- $5,465 · $455/mo
- Expected delta
- +$2,562/yr (+$214/mo · 88.3%)
ⓘ Screening estimate from a state-policy table — verify with the county assessor before closing.
Climate risk First Street
- Flood 1/10 Low FEMA zone X · 0% chance over 30 yrs
- Wildfire 3/10 Moderate
- Heat 4/10 Moderate 7 d/yr ≥97°F today · 15 d/yr by 30 yrs out
- Wind 3/10 Moderate 8% chance of damaging wind over 30 yrs
- Air quality 2/10 Low 1 unhealthy d/yr today · 2 by 30 yrs out
Nearby sold comps map
Loading sold comps map…
Walkable amenities ~0.75 mi
Loading nearby amenities…
Taxation est. · year 1
- Rental income
- $31,526
- − Mortgage interest
- −$26,607
- − Property taxes
- −$2,903
- − Insurance
- −$2,375
- − Repairs & maintenance
- −$2,522
- − Management
- −$2,522
- − Depreciation
- −$13,818
- Taxable loss
- −$19,222
- Est. tax savings @ 24.0%
- +$4,613
- After-tax cash flow
- $-5,651/yr
For passive investors: Depreciation is non-cash, so a rental often shows a tax loss while cash-flowing — sheltering income. Rental losses are passive: they offset passive income freely, and up to $25,000/yr can offset ordinary (W-2) income if you actively participate and your MAGI is under $100k (phasing out to $0 by $150k); unused losses carry forward. On sale, claimed depreciation is recaptured at up to 25%, and gains may owe capital-gains tax (a 1031 exchange can defer both). Figures are a year-1 estimate at your 24.0% rate — not tax advice; consult a CPA.
Schools (NCES district)
- District
- Hudson City School District
- NCES district ID
- 3614940
- Math proficiency
- 38% ▲ 4.00%
- Reading proficiency
- 47% ▲ 7.00%
- Median HH income
- $44,663
- Composite
- 36.03/100
- National rank
- #4779
- State rank
- #494 of 590 in NY
Livability — Claverack-Red Mills
No livability data for this city. (Only ~50 U.S. cities are tracked.)
Census & demographics
- County
- Columbia County · 17,176 people
- City population
- 198
- Metro
- Hudson, NY
- Population (ZIP)
- 17,176
- Household income
- $72,741
- Rent vs Own
- Severe rent burden
- 1083.0
Population outlook (Columbia County) Hauer SSP2
- Today (2025)
- 58,662 people
- By 2030
- 56,557 · -3.6%
- By 2040
- 51,324 · -12.5%
- By 2050
- 45,790 · -21.9%
- By 2075
- 35,232 · -39.9%
- By 2100
- 25,846 · -55.9%
Race, ethnicity, and origin ACS 2023
- Neighborhood character
- Predominantly White (74%)
- Race & ethnicity
- White 74% Two or more races 7% Black 7% Hispanic / Latino 7% Asian 6%
- Hispanic origin (detail)
- Mexican 2% Puerto Rican 1%
- Common ancestry
- Lithuanian 4% Romanian 4% Iranian 3%
- Foreign-born
- 10% · Canada, China
- Languages at home
- 88% English-only · Spanish 5% Other Indo-European 3% Chinese 1%
Political lean MEDSL · Columbia
- 2024 margin
- D (+14.7) · D 57.4% · R 42.6%
- 2008→2024 swing
- +1.3pp toward D · 2008: 13.4pp · 2024: 14.7pp
- All cycles
- 2024: D+14.7 2020: D+16.7 2016: D+1.4 2012: D+11.7 2008: D+13.4
Not yet ingested
- Civics
- —
Market trends
- HPI YoY
- ▲ 25.98%
- Current HPI
- 490.0412
- Rent YoY
- ▲ 10.88%
- Metro
- Hudson, NY
- State GDP YoY
- ▲ 2.60%
- F500 in state
- 92
Industry mix (Fortune 500 HQ in NY)
| Industry | F500 HQs | Revenue |
|---|---|---|
| Financial Services | 10 | $950B |
|
||
| Consumer Goods | 9 | $162B |
|
||
| Insurance | 4 | $225B |
|
||
| Telecommunications | 2 | $144B |
|
||
| Pharmaceuticals | 2 | $112B |
|
||
| Media / Entertainment | 2 | $69B |
|
||
Price history
-24.0% since first listed6 events — show timeline
- 2026-06-10 Pending — HVCRMLS
- 2026-05-11 Contingent — HVCRMLS
- 2026-04-23 Listed $475,000 HVCRMLS
- 2020-12-21 Listed $510,000 HVCRMLS
- 2020-07-26 Listed $510,000 HVCRMLS
- 2020-06-18 Listed $625,000 HVCRMLS
Property tax history
+2.8%/yrLatest (2025): $2,903 · +22.3% YoY. Source: county tax records.
Cash-flow waterfall
monthlySold comps — $/sqft
last 12 mo · ≤1 miLoading sold comps…