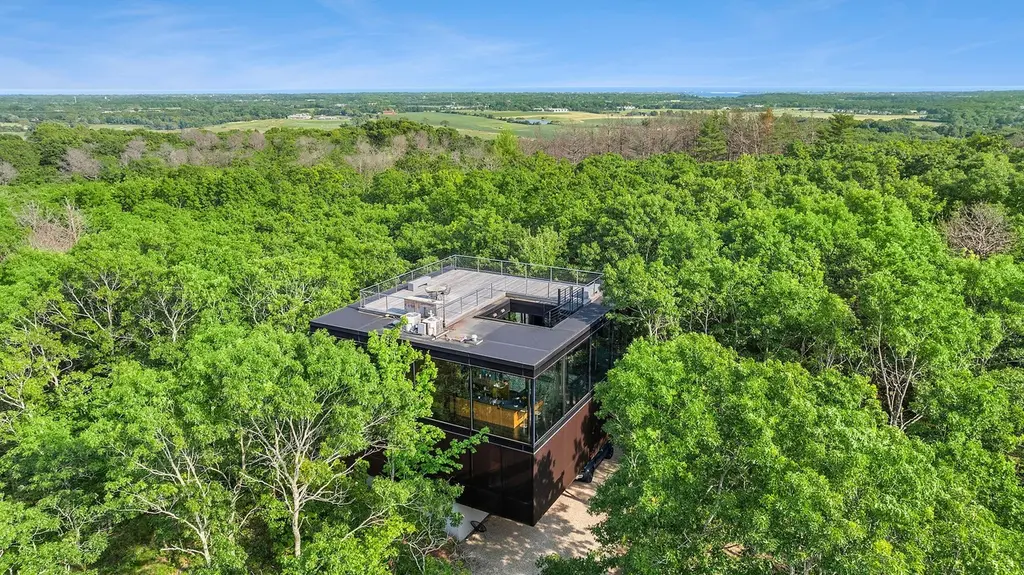
1052 Noyac Path
Water Mill, NY 11976
$7,850,000D
5 bd · 4.0 ba ·
3,528 sqft ·
Built 2007
· SingleFamily
· Coming Soon
· 5 DOM
Cashflow @ list (25.0% down · 7.5%)
Estimated rent
$58,057/mo
Mortgage (P&I)
−$41,166
Tax + insurance
−$13,083
HOA
−$0
Vac / Maint / Mgmt
−$12,192
Net cashflow
$-8,385/mo
Annual
$-100,619/yr
Cap rate
5.01%
Cash-on-cash
-4.58%
DSCR
0.80
1% rule
0.74%
Cash to close
$2,198,000
Investor read
- This is a 5-bed/4.0-bath single-family listed at $7.85M.
- At list price, monthly cash flow is $-8k ($-101k/yr) — negative.
- To cash-flow at today's rent, offer at most $6.64M (15.5% below list).
- To meet the 1% rule (rent ≥ 1% of price), the offer needs to be $5.81M (26.0% below list).
- Only 5 days on market — expect competitive offers; lowballing is unlikely to land.
- Recommended offer: $5.81M (26.0% below list) — sets the bar for 1% rule.
- In year one you build about $732k of equity ($54k loan paydown + $677k appreciation (8.6% local appreciation)).
- Location reads 71/100 on livability (#410 in NY) — a middle-class / working-renter tenant base. Strengths: crime A+, employment A+, commute A-; Watch: amenities F, cost of living F, housing F.
- Southampton Union Free School District (suburban): math 53% / reading 51% proficiency, ranked #293 of 590 in NY (top 50%) — acceptable for families but not a draw, mixed tenant base, ~2y average lease.
- Zoned schools: Southampton Elementary School (math 42% / reading 57%, grade D, #1,085 of 2,108 statewide, top 56%, 376 students, 51% FRL); Southampton Intermediate School (math 30% / reading 47%, grade F, #437 of 729 statewide, top 60%, 363 students, 44% FRL); Southampton High School (math 98%, 595 students, 48% FRL) — zoned schools average 48% FRL vs 30% district-wide (17 pts higher); higher-poverty schools than district average — tighter screening recommended.
- Market conditions: Rents rising fast (+30.1%/yr); 52 active listings in the ZIP; 1 comparable units currently listed for rent nearby; high-income renter base; 1,366 units permitted in Suffolk County in 2024 (216 in 5+ unit buildings).
- Suffolk County population projected to shrink 5% by 2050 — rents likely to lag national; underwrite the cash flow, not the appreciation.
- By year 2, paydown + projected appreciation supports a ~$1.17M cash-out refi (75% LTV) — recoverable capital for the next deal without selling this one.
- Cap rate 5.0% vs local median 10.6% in Water Mill — below-typical yield; the buyer is paying a premium for something (appreciation thesis, condition, location) that the cap rate doesn't capture.
- At $58,057/mo this rent would consume 387% of the median local household income ($180k/yr) — very limited rent-growth headroom before tenants either downsize or default.
Questions for listing agent
- What do current leases actually rent for vs. the listed asking? Can we see a recent rent roll and the last 12 months of T-12 income?
- Is there a deadline driving the sale (1031 exchange, divorce, estate, relocation)? That informs how much negotiation room exists.
- The area grade is low — what's the realistic commute time and amenity access for the typical tenant pool here? Any planned neighborhood developments (good or bad) we should know about?
- What's the average days-on-market for RENTAL listings here right now (not sales)? A rising rental-DOM trend means longer vacancies and softer asking-rent achievability than the comps imply.
- What's the recent tenant-quality profile in this submarket — average credit score on applications, eviction rate, late-payment / NSF rate, and stable-employment percentage? A property-management company in the area should have these aggregated.
- How much new for-sale + rental construction is in the pipeline within 1–3 miles? Heavy new supply typically softens prices + rents 12–24 months out; constrained supply supports both.
CashFlowRE · CFR-V277FF4XZTWM35
· Data 3 weeks ago
cashflowre.app · 2026-05-29