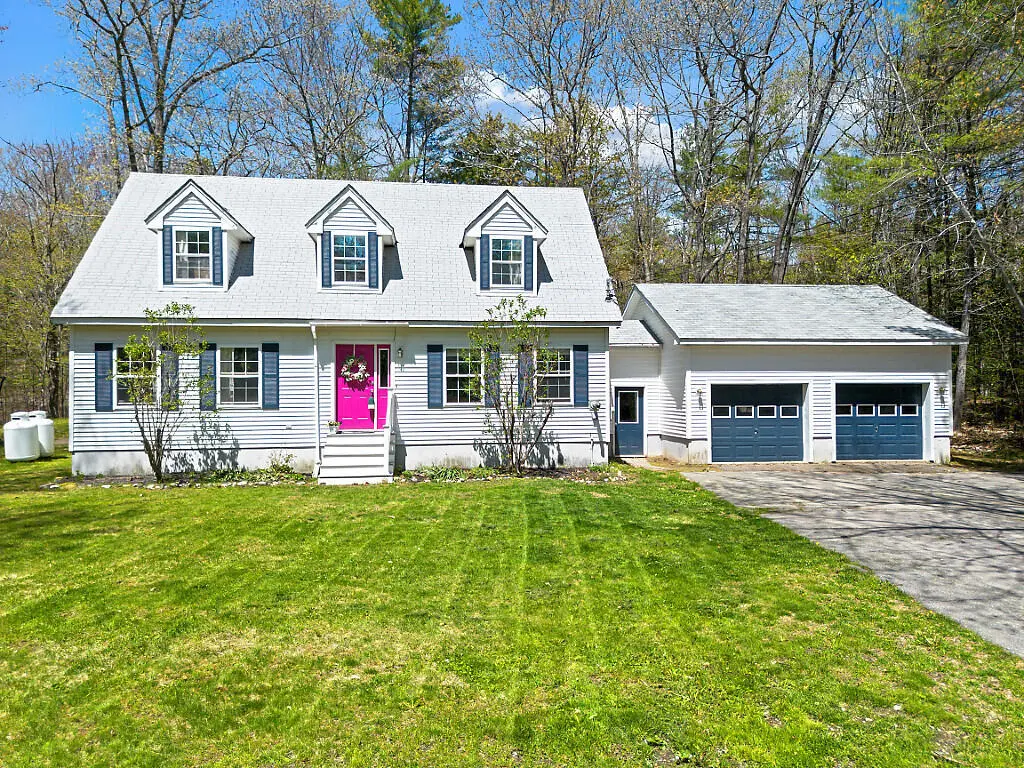
304 Rocky Shore Ln
Oakland, ME 04963
$365,000D
3 bd · 1.5 ba ·
1,960 sqft ·
Built 1990
· SingleFamily
· Pending
· 3 DOM
Cashflow @ list (25.0% down · 7.5%)
Estimated rent
$1,867/mo
Mortgage (P&I)
−$1,914
Tax + insurance
−$396
HOA
−$30
Vac / Maint / Mgmt
−$392
Net cashflow
$-865/mo
Annual
$-10,384/yr
Cap rate
3.45%
Cash-on-cash
-10.16%
DSCR
0.55
1% rule
0.51%
Cash to close
$102,200
Investor read
- This is a 3-bed/1.5-bath single-family listed at $365k.
- At list price, monthly cash flow is $-865 ($-10k/yr) — negative.
- To cash-flow at today's rent, offer at most $212k (41.9% below list).
- To meet the 1% rule (rent ≥ 1% of price), the offer needs to be $187k (48.8% below list).
- Only 3 days on market — expect competitive offers; lowballing is unlikely to land.
- Recommended offer: $187k (48.8% below list) — sets the bar for 1% rule.
- In year one you build about $39k of equity ($3k loan paydown + $36k appreciation (10.0% local appreciation)).
- Location reads 75/100 on livability (#37 in ME, #3,871 nationally) — a middle-class / working-renter tenant base. Strengths: crime A+, cost of living A+, housing A+; Watch: employment D+, amenities F, commute F.
- RSU 18 (rural): math 88% / reading 89% proficiency, ranked #36 of 112 in ME (top 32%) — strong family-tenant draw, lease renewals of 3-5y typical.
- Zoned schools: Williams Elementary School (math 92% / reading 93%, grade A+, #24 of 294 statewide, top 8%, 227 students, 38% FRL); Messalonskee Middle School (math 86% / reading 88%, grade A+, #28 of 85 statewide, top 37%, 452 students, 32% FRL); Messalonskee High School (math 92% / reading 92%, grade A+, #27 of 108 statewide, top 36%, 725 students, 25% FRL) — zoned schools at 32% FRL track the district average.
- Market conditions: 72 active listings in the ZIP; 460 units permitted in Kennebec County in 2024 (0 in 5+ unit buildings).
- Kennebec County population projected at -17% by 2050 — secular population decline; favor cash flow + early exit over multi-decade hold.
- 5 sale attempts since 9y ago with the ask held roughly flat each time — persistent listings suggest the price (not the market) is what's stuck; bring a comps-based counter.
- Current owner paid $297k; 23% above their basis — modest negotiation headroom, anchor on the comps not their cost.
- By year 2, paydown + projected appreciation supports a ~$63k cash-out refi (75% LTV) — recoverable capital for the next deal without selling this one.
- Cap rate 3.4% vs local median 2.1% in Oakland — top-decile yield for the area; either an underpriced asset or a hidden risk that comps aren't pricing in. Stress-test before assuming the spread holds.
Questions for listing agent
- What do current leases actually rent for vs. the listed asking? Can we see a recent rent roll and the last 12 months of T-12 income?
- What does the HOA fee cover, when was the last increase, and are there any pending special assessments or reserve-fund shortfalls?
- Is there a deadline driving the sale (1031 exchange, divorce, estate, relocation)? That informs how much negotiation room exists.
- The area grade is low — what's the realistic commute time and amenity access for the typical tenant pool here? Any planned neighborhood developments (good or bad) we should know about?
- What's the average days-on-market for RENTAL listings here right now (not sales)? A rising rental-DOM trend means longer vacancies and softer asking-rent achievability than the comps imply.
- What's the recent tenant-quality profile in this submarket — average credit score on applications, eviction rate, late-payment / NSF rate, and stable-employment percentage? A property-management company in the area should have these aggregated.
- How much new for-sale + rental construction is in the pipeline within 1–3 miles? Heavy new supply typically softens prices + rents 12–24 months out; constrained supply supports both.
CashFlowRE · CFR-V2K4VQEPZHVSW1
· Data 3 weeks ago
cashflowre.app · 2026-05-29