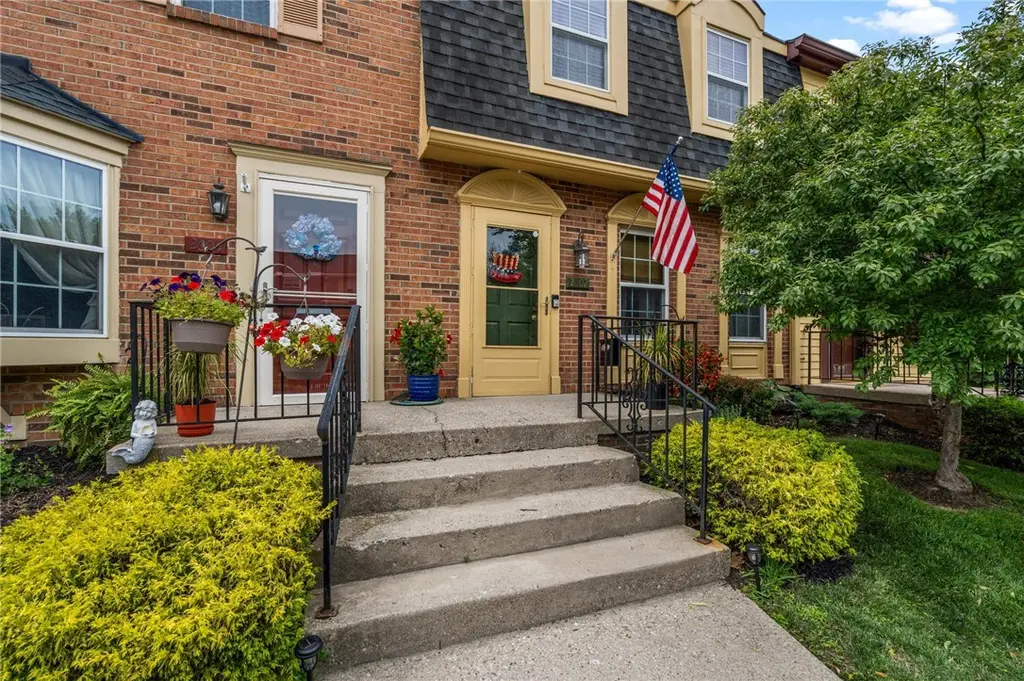
2602 S Kings Arms Cir
Centerville, OH 45440
$199,999D
3 bd · 2.5 ba ·
1,332 sqft ·
Built 1975
· Condo
· Active
· 2 DOM
Cashflow @ list (25.0% down · 7.5%)
Estimated rent
$1,966/mo
Mortgage (P&I)
−$1,049
Tax + insurance
−$343
HOA
−$206
Vac / Maint / Mgmt
−$413
Net cashflow
$-45/mo
Annual
$-540/yr
Cap rate
6.02%
Cash-on-cash
-0.96%
DSCR
0.96
1% rule
0.98%
Cash to close
$56,000
Investor read
- This is a 3-bed/2.5-bath condo listed at $200k.
- At list price, monthly cash flow is $-45 ($-540/yr) — negative.
- To cash-flow at today's rent, offer at most $192k (4.0% below list).
- To meet the 1% rule (rent ≥ 1% of price), the offer needs to be $197k (1.7% below list).
- Only 2 days on market — expect competitive offers; lowballing is unlikely to land.
- Recommended offer: $192k (4.0% below list) — sets the bar for cash-flow.
- Local home prices are declining (-3.0%/yr); year-one equity from $1k of loan paydown is wiped out by about $6k of value loss. Plan a longer hold.
- Location reads 85/100 on livability (#45 in OH, #604 nationally) — a professional / high-income tenant draw. Strengths: crime A+, cost of living A+, housing A+; Watch: amenities D+, commute F.
- Kettering City School District (suburban): math 54% / reading 68% proficiency, ranked #277 of 656 in OH (top 42%) — acceptable for families but not a draw, mixed tenant base, ~2y average lease.
- Zoned schools: Kettering Fairmont High School (math 49% / reading 75%, grade B-, #202 of 781 statewide, top 29%, 2,486 students, 32% FRL) — zoned schools at 32% FRL track the district average.
- Market conditions: Rents rising fast (+4.3%/yr); 119 active listings in the ZIP; 9 comparable units currently listed for rent nearby; rentals at typical pace (median 16d on market — plan ~3-4 weeks tenant-placement turnaround); solid renter incomes; 907 units permitted in Montgomery County in 2024 (416 in 5+ unit buildings).
- Montgomery County population projected at -10% by 2050 — secular population decline; favor cash flow + early exit over multi-decade hold.
- 3 sale attempts since 18y ago with the ask held roughly flat each time — persistent listings suggest the price (not the market) is what's stuck; bring a comps-based counter.
- Current owner paid $54k; list at $200k implies a 267% gain — meaningful room to come down on a strong offer.
- Cap rate 6.0% vs local median 2.9% in Centerville — top-decile yield for the area; either an underpriced asset or a hidden risk that comps aren't pricing in. Stress-test before assuming the spread holds.
Questions for listing agent
- What do current leases actually rent for vs. the listed asking? Can we see a recent rent roll and the last 12 months of T-12 income?
- Built in 1975 — when were the roof, HVAC, electrical panel, plumbing, and water heater last replaced?
- What does the HOA fee cover, when was the last increase, and are there any pending special assessments or reserve-fund shortfalls?
- Any open or pending special assessments — roof, HVAC, plumbing, elevator, façade? What's the per-unit balance and payoff schedule, and is the seller paying it off at close or rolling it to the buyer?
- Is there a deadline driving the sale (1031 exchange, divorce, estate, relocation)? That informs how much negotiation room exists.
- Schools are A-rated — typically a magnet for longer-tenancy family renters. What's the average tenant stay here, and is there a school-zone premium baked into asking?
- The area grade is low — what's the realistic commute time and amenity access for the typical tenant pool here? Any planned neighborhood developments (good or bad) we should know about?
- What's the average days-on-market for RENTAL listings here right now (not sales)? A rising rental-DOM trend means longer vacancies and softer asking-rent achievability than the comps imply.
CashFlowRE · CFR-V2YGX1EH15AG17
· Data 8 h ago
cashflowre.app · 2026-05-29