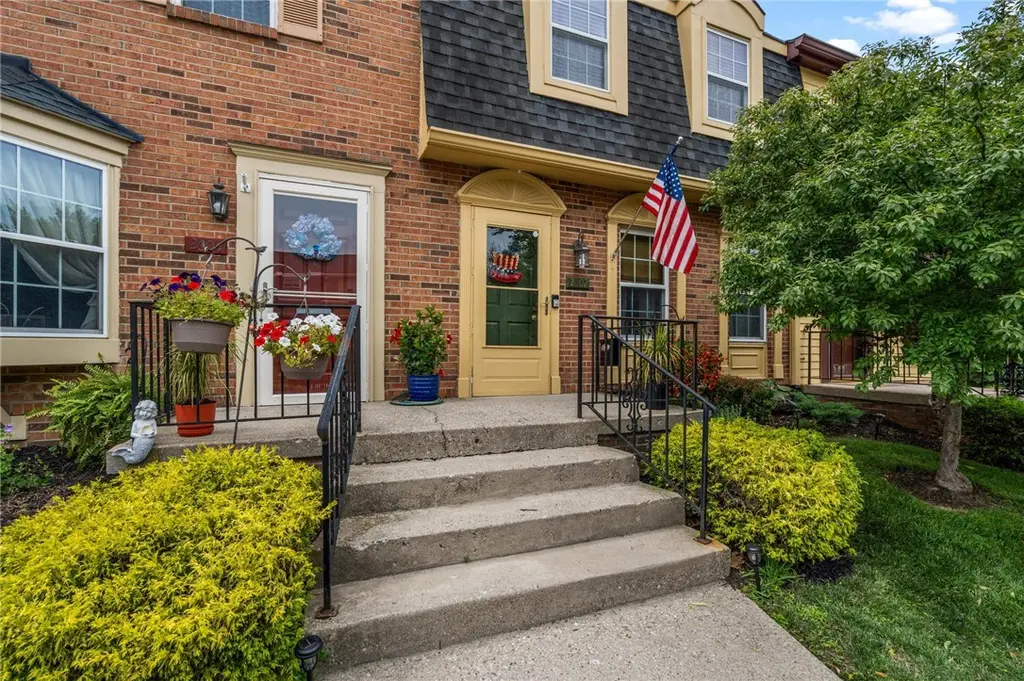
2602 S Kings Arms Cir · Centerville, OH
Flood risk 1/10 · Minimal
- FEMA flood zone
- X (unshaded)
- Chance of flooding over 30 yrs
- 0.0%
- Est. flood insurance / yr
- $507 – $1,088
Fire risk 1/10 · Minimal
- Est. fire insurance / yr
- $713 – $1,323
Heat risk 3/10 · Minor
- Hot days now (above 100°F)
- 7 days/yr
- Hot days in 30 yrs
- 19 days/yr
Wind risk 2/10 · Minimal
- Chance of severe wind over 30 yrs
- 1.0%
Air-quality risk 3/10 · Minor
- Unhealthy air days now
- 2 days/yr
- Unhealthy air days in 30 yrs
- 3 days/yr
Risk factors via First Street. Map © Google.
Why this score? — see what drove the D grade
The composite is a weighted blend of 9 inputs, each scored 0–100. Each bar is that input's sub-score; the figure is the points it added to the 100-point composite (weight × sub-score).
- Cash flow +12.1/30.0
- ARV discount +7.5/15.0
- Schools +5.2/10.0
- 1% rule +4.8/10.0
- Livability +4.2/5.0
- DSCR +3.6/10.0
- Rent growth +3.6/5.0
- Condition / age +2.5/5.0
- Appreciation +0.0/10.0
$199,999
🖨 Deal sheet (PDF) 📄 Offer letter ✓ Due diligence
Listing remarks MLS
Beautiful 2 story condo with fireplace, 2 seperate living spaces, 2 full baths upstairs, and a private patio setting. Seller requires a Bank of America prequal letter for all offers requiring a mortgage. Sold as is, seller will make no repairs, Rm sizes est, and buyer to rely upon their own inspection.
Key facts
- Spectacular kitchen
- Updated half bath
- Stylish pantry
Tags
Property features AI
Finance
- Other: Property listed for sale
- HOA & community: Homeowners association (Apple Management) with a monthly fee of $206; HOA covers association management, pool(s), and snow removal
Exterior
- Parking: No garage
- Security: Smoke detector(s)
- Utilities: Sewer available; Water available (private source); Electric service
- Home design: 2-story home; Entry level is 1
- Construction: Cedar construction; Slab foundation
- Exterior features: Lot dimensions approximately 36 x 18 x 36 x 18; Residential zoning
Interior
- Kitchen: Electric water heater (serves kitchen appliances)
- Bedrooms: Bedrooms on multiple levels (total rooms: 7)
- Bathrooms: 2 full bathrooms; 1 half bathroom; 3 bathrooms on the main level
- Heating & cooling: Electric forced-air heating; Central air conditioning; Heat pump
- Interior features: Ceiling fan(s); Walk-in closet(s); Wood-burning fireplace
- Laundry & utility: Electric water heater
Neighborhood map
What this means for you Summary
Snapshot
- This is a 3-bed/2.5-bath condo listed at $200k.
Deal economics
- At list price, monthly cash flow is $-45 ($-540/yr) — negative.
- To cash-flow at today's rent, offer at most $192k (4.0% below list).
- To meet the 1% rule (rent ≥ 1% of price), the offer needs to be $197k (1.7% below list).
- Recommended offer: $192k (4.0% below list) — sets the bar for cash-flow.
- Cap rate 6.0% vs local median 2.9% in Centerville — top-decile yield for the area; either an underpriced asset or a hidden risk that comps aren't pricing in. Stress-test before assuming the spread holds.
Location & tenants
- Location reads 85/100 on livability (#45 in OH, #604 nationally) — a professional / high-income tenant draw. Strengths: crime A+, cost of living A+, housing A+; Watch: amenities D+, commute F.
- Kettering City School District (suburban): math 54% / reading 68% proficiency, ranked #277 of 656 in OH (top 42%) — acceptable for families but not a draw, mixed tenant base, ~2y average lease.
- Zoned schools: Kettering Fairmont High School (math 49% / reading 75%, grade B-, #202 of 781 statewide, top 29%, 2,486 students, 32% FRL) — zoned schools at 32% FRL track the district average.
- Market conditions: Rents rising fast (+4.3%/yr); 119 active listings in the ZIP; 9 comparable units currently listed for rent nearby; rentals at typical pace (median 16d on market — plan ~3-4 weeks tenant-placement turnaround); solid renter incomes; 907 units permitted in Montgomery County in 2024 (416 in 5+ unit buildings).
Forward outlook
- Local home prices are declining (-3.0%/yr); year-one equity from $1k of loan paydown is wiped out by about $6k of value loss. Plan a longer hold.
- Montgomery County population projected at -10% by 2050 — secular population decline; favor cash flow + early exit over multi-decade hold.
Negotiation context
- Only 2 days on market — expect competitive offers; lowballing is unlikely to land.
- 3 sale attempts since 18y ago with the ask held roughly flat each time — persistent listings suggest the price (not the market) is what's stuck; bring a comps-based counter.
- Current owner paid $54k; list at $200k implies a 267% gain — meaningful room to come down on a strong offer.
Questions for the listing agent
- What do current leases actually rent for vs. the listed asking? Can we see a recent rent roll and the last 12 months of T-12 income?
- Built in 1975 — when were the roof, HVAC, electrical panel, plumbing, and water heater last replaced?
- What does the HOA fee cover, when was the last increase, and are there any pending special assessments or reserve-fund shortfalls?
- Any open or pending special assessments — roof, HVAC, plumbing, elevator, façade? What's the per-unit balance and payoff schedule, and is the seller paying it off at close or rolling it to the buyer?
- Is there a deadline driving the sale (1031 exchange, divorce, estate, relocation)? That informs how much negotiation room exists.
- Schools are A-rated — typically a magnet for longer-tenancy family renters. What's the average tenant stay here, and is there a school-zone premium baked into asking?
- The area grade is low — what's the realistic commute time and amenity access for the typical tenant pool here? Any planned neighborhood developments (good or bad) we should know about?
- What's the average days-on-market for RENTAL listings here right now (not sales)? A rising rental-DOM trend means longer vacancies and softer asking-rent achievability than the comps imply.
- What's the recent tenant-quality profile in this submarket — average credit score on applications, eviction rate, late-payment / NSF rate, and stable-employment percentage? A property-management company in the area should have these aggregated.
- How much new apartment / multifamily construction is in the pipeline within 1–3 miles? Heavy new supply (>2% of stock underway) typically softens rents 12–24 months out; light construction supports rent growth.
Investment metrics
- 1% rule
- 0.98% ✗
- Cap rate
- 6.02%
- Cash-on-cash
- -0.96%
- DSCR
- 0.96
- GRM
- 8.5
CMA / ARV
No comps found within radius.
Projected returns pro-forma
-3.0% appreciation · 4.35% rent growth · sell at horizon
- IRR
- -16.0%
- Equity multiple
- 0.42×
- Total profit
- $-32,406
- Equity at exit
- $29,821
- IRR
- -5.1%
- Equity multiple
- 0.65×
- Total profit
- $-19,833
- Equity at exit
- $17,292
Cash invested: $56,000 (down + closing). Projections, not guarantees.
Landlord ↔ Tenant lean methodology
- Overall (STATE)
- 73 Landlord-Friendly
- State Ohio
- 73 Landlord-Friendly · R+6
- County
- — inherits STATE
- City
- — inherits STATE
ZIP-level market 45440
- Rents YoY
- 4.3%
- Active inventory
- 119
- Price-to-rent
- 8.5×
Monthly cashflow live
- Estimated rent
- $1,966 high interval (Pro) →
- Mortgage (P&I)
- −$1,049
- Tax from tax record
- −$260 /mo · $3,121/yr
- Insurance
- −$83
- HOA
- −$206
- Vacancy / Maint / Mgmt
- −$413
- Net cashflow
- $-45
Break-even live
Sensitivity live
| Price | -10% $68 | -5% $12 | +0% $-45 | +5% $-102 | +10% $-158 |
|---|---|---|---|---|---|
| Rent | -10% $-200 | -5% $-123 | +0% $-45 | +5% $33 | +10% $110 |
| Rate | -1.0pp $56 | -0.5pp $6 | base $-45 | +0.5pp $-97 | +1.0pp $-150 |
UW: 25.0% down · 7.5% · 30yr · 1.5% tax · 5.0% vac · 8.0% maint · 8.0% mgmt
Financing live
Cash to close
- Down payment
- $50,000
- Closing costs
- $6,000
- Reserves months
- —
- Total cash needed
- —
Loan-product check · same deal, 3 products live
Conventional
25% down · 7.5% · 30yr
- Down + closing
- —
- Monthly P&I
- —
- Monthly cashflow
- —
- DSCR
- —
- Eligible?
- —
Personal DTI + credit; lowest rate.
DSCR
20% down · 8.5% · 30yr
- Down + closing
- —
- Monthly P&I
- —
- Monthly cashflow
- —
- DSCR
- —
- Eligible?
- —
No personal income docs; deal must DSCR.
Hard money
10% down · 12.0% · 12mo
- Down + closing
- —
- Monthly P&I
- —
- Monthly cashflow
- —
- DSCR
- —
- Eligible?
- —
Short-term bridge; refi at stabilization.
Rent comps 9 comps
| Address | Beds | Baths | Sqft | Rent | $/sqft | DOM | Units | Dist |
|---|---|---|---|---|---|---|---|---|
| 5685 Coach Dr E Apt E Kettering, OH | 3.0 | 2.0 | 1146 | $1,375 | $1.20 | 45d | 1 | 0.59mi |
| 6591 Brigham Sq #7 Dayton, OH | 2.0 | 2.0 | 1077 | $1,500 | $1.39 | 23d | 1 | 0.85mi |
| 1635 Autumn Spice Pl Unit NA Dayton, OH | 3.0 | 2.5 | 1651 | $2,725 | $1.65 | 4d | 1 | 0.90mi |
| 1635 Autumn Spice Pl Dayton, OH | 3.0 | 2.5 | 1651 | $2,850 | $1.73 | 25d | 1 | 0.90mi |
| 515 Kilkenny Ct Unit NA Sugarcreek Township, OH | 3.0 | 2.0 | 1500 | $2,545 | $1.70 | 16d | 1 | 0.94mi |
| 6620 Green Branch Dr #4 Centerville, OH | 2.0 | 2.0 | 987 | $1,375 | $1.39 | 4d | 1 | 1.00mi |
| 4838 Wilmington Pike Dayton, OH | 3.0 | 2.0 | 1463 | $2,650 | $1.81 | 25d | 1 | 1.02mi |
| 1848 Chimney Ln Kettering, OH | 2.0 | 1.0 | 956 | $1,195 | $1.25 | 4d | 1 | 1.12mi |
| 4516 Drayton Ct Dayton, OH | 3.0 | 2.0 | 1442 | $2,550 | $1.77 | 13d | 1 | 1.49mi |
HOA detail condo
- Monthly dues
- $206 · $2,472/yr
- Assessments
- None detected in remarks — confirm with the listing agent.
Listing history 2 events
-
2026-06-21remarks 693-char remark
-
2026-06-21$199,999 Active 2 DOM
ⓘ Source: listings_history table (triggers on properties + properties_extension) + one-shot
backfill from property_details.listing_events for pre-trigger history.
Tax reassessment forecast OH · Partial reset (capped growth)
- Current annual tax
- $3,121 · $260/mo
- Projected year-2 tax
- $3,121 · $260/mo
- Expected delta
- $0/yr ($0/mo · 0.0%)
ⓘ Screening estimate from a state-policy table — verify with the county assessor before closing.
Climate risk First Street
- Flood 1/10 Low FEMA zone X (unshaded) · 0% chance over 30 yrs
- Wildfire 1/10 Low
- Heat 3/10 Moderate 7 d/yr ≥100°F today · 19 d/yr by 30 yrs out
- Wind 2/10 Low 100% chance of damaging wind over 30 yrs
- Air quality 3/10 Moderate 2 unhealthy d/yr today · 3 by 30 yrs out
Nearby sold comps map
Loading sold comps map…
Walkable amenities ~0.75 mi
Loading nearby amenities…
Taxation est. · year 1
- Rental income
- $23,594
- − Mortgage interest
- −$11,203
- − Property taxes
- −$3,121
- − Insurance
- −$1,000
- − Repairs & maintenance
- −$1,888
- − Management
- −$1,888
- − HOA
- −$2,472
- − Depreciation
- −$5,818
- Taxable loss
- −$3,796
- Est. tax savings @ 24.0%
- +$911
- After-tax cash flow
- $371/yr
For passive investors: Depreciation is non-cash, so a rental often shows a tax loss while cash-flowing — sheltering income. Rental losses are passive: they offset passive income freely, and up to $25,000/yr can offset ordinary (W-2) income if you actively participate and your MAGI is under $100k (phasing out to $0 by $150k); unused losses carry forward. On sale, claimed depreciation is recaptured at up to 25%, and gains may owe capital-gains tax (a 1031 exchange can defer both). Figures are a year-1 estimate at your 24.0% rate — not tax advice; consult a CPA.
Schools (NCES district)
- District
- Kettering City School District
- NCES district ID
- 3904418
- Math proficiency
- 54% ▼ -21.00%
- Reading proficiency
- 68% ▼ -9.00%
- Median HH income
- $50,353
- Composite
- 51.89/100
- National rank
- #1653
- State rank
- #277 of 656 in OH
Livability — Centerville
- Score
- 85/100
- State rank
- #45
- US rank
- #604
Category grades
Schools grade is shown separately in the Schools card above.
Census & demographics
- Census place
- Centerville, OH
- County
- Greene County · 132,120 people
- City population
- 38,712
- Metro
- Dayton-Kettering, OH
- Population (ZIP)
- 22,358
- Household income
- $82,383
- Rent vs Own
- Severe rent burden
- 626.0
Population outlook (Montgomery County) Hauer SSP2
- Today (2025)
- 523,241 people
- By 2030
- 514,948 · -1.6%
- By 2040
- 493,378 · -5.7%
- By 2050
- 469,639 · -10.2%
- By 2075
- 418,360 · -20.0%
- By 2100
- 353,315 · -32.5%
Race, ethnicity, and origin ACS 2023
- Neighborhood character
- Predominantly White (82%)
- Race & ethnicity
- White 82% Two or more races 9% Black 5% Hispanic / Latino 5% Asian 2%
- Common ancestry
- Romanian 2% Lithuanian 2% Italian 2%
- Foreign-born
- 6% · Canada, South Korea
- Languages at home
- 92% English-only · Spanish 3% French/Haitian/Cajun 1% Arabic 1%
Political lean MEDSL · Montgomery
- 2024 margin
- Toss-up / Even · D 49.8% · R 49.3%
- 2008→2024 swing
- -5.8pp toward R · 2008: 6.2pp · 2024: 0.5pp
- All cycles
- 2024: D+0.5 2020: D+2.2 2016: R+1.2 2012: D+3.1 2008: D+6.2
Not yet ingested
- Civics
- —
Market trends
- HPI YoY
- ▼ -168.53%
- Current HPI
- 217.1026
- Rent YoY
- ▲ 4.35%
- Metro
- Dayton-Kettering, OH
- State GDP YoY
- ▲ 1.98%
- F500 in state
- 48
Industry mix (Fortune 500 HQ in OH)
| Industry | F500 HQs | Revenue |
|---|---|---|
| Insurance | 3 | $145B |
|
||
| Industrial Machinery | 3 | $49B |
|
||
| Financial Services | 3 | $24B |
|
||
| Consumer Goods | 2 | $93B |
|
||
| Aerospace / Defense | 2 | $47B |
|
||
| Utilities | 2 | $33B |
|
||
Price history
+227.9% since first listed11 events — show timeline
- 2026-06-19 Price Changed $199,999 Dayton MLS
- 2026-06-19 Listed $200,000 Dayton MLS
- 2012-07-13 Sold (MLS) $54,500 Dayton MLS
- 2012-07-13 Sold (MLS) $54,500 Dayton MLS
- 2012-05-07 Listing Removed — Dayton MLS
- 2012-04-02 Listed $57,000 Dayton MLS
- 2010-06-30 Listing Removed — Dayton MLS
- 2008-04-30 Listed $90,000 Dayton MLS
- 2005-11-29 Sold (Public Records) $98,700 Public Records
- 2000-04-07 Sold (Public Records) $75,000 Public Records
- 1989-09-01 Sold (Public Records) $61,000 Public Records
Property tax history
+4.3%/yrLatest (2025): $3,121 · -0.2% YoY. Source: county tax records.
Cash-flow waterfall
monthlySold comps — $/sqft
last 12 mo · ≤1 miLoading sold comps…