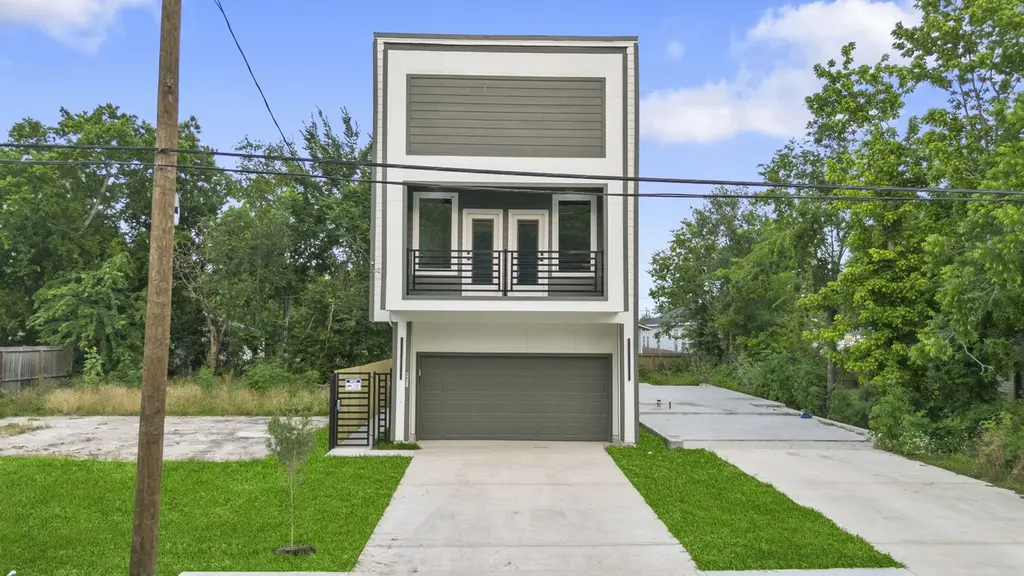
6631 Foster St
Houston, TX 77021
$309,000D-
3 bd · 2.5 ba ·
1,972 sqft ·
Built 2025
· Other
· Active
· 94 DOM
Cashflow @ list (25.0% down · 7.5%)
Estimated rent
$2,224/mo
Mortgage (P&I)
−$1,620
Tax + insurance
−$282
HOA
−$0
Vac / Maint / Mgmt
−$467
Net cashflow
$-145/mo
Annual
$-1,743/yr
Cap rate
5.73%
Cash-on-cash
-2.01%
DSCR
0.91
1% rule
0.72%
Cash to close
$86,520
Investor read
- This is a 3-bed/2.5-bath other listed at $309k.
- At list price, monthly cash flow is $-145 ($-2k/yr) — negative.
- To cash-flow at today's rent, offer at most $283k (8.3% below list).
- To meet the 1% rule (rent ≥ 1% of price), the offer needs to be $222k (28.0% below list).
- It's been on market 94 days — a 9% lower offer ($281k) is reasonable based on typical stale-listing flexibility.
- Recommended offer: $222k (28.0% below list) — sets the bar for 1% rule.
- Local home prices are declining (-3.0%/yr); year-one equity from $2k of loan paydown is wiped out by about $9k of value loss. Plan a longer hold.
- Location reads 74/100 on livability (#184 in TX, #4,771 nationally) — a middle-class / working-renter tenant base. Strengths: amenities A+, cost of living A+, housing A+; Watch: schools D, crime F.
- Houston ISD (urban): math 27% / reading 35% proficiency, ranked #593 of 826 in TX (top 72%) — families likely to look elsewhere, expect single-tenant / working-renter base with shorter leases; 71% free/reduced lunch — lower-income household profile, screen leases tightly.
- Market conditions: Rents rising (+2.2%/yr); 471 active listings in the ZIP; 40 comparable units currently listed for rent nearby; rentals at typical pace (median 18d on market — plan ~3-4 weeks tenant-placement turnaround); 29,883 units permitted in Harris County in 2024 (8,621 in 5+ unit buildings).
- Harris County population projected at +47% by 2050 — long-run rental-demand tailwind backs the buy-and-hold thesis.
- 16 sale attempts since 10y ago; this cycle's ask is 13335% above the opening price — seller raised mid-cycle; expect resistance to lowballs.
- Cap rate 5.7% vs local median 3.2% in Houston — top-decile yield for the area; either an underpriced asset or a hidden risk that comps aren't pricing in. Stress-test before assuming the spread holds.
- At $2,224/mo this rent would consume 59% of the median local household income ($46k/yr) (locally 2532% of renters already pay >50% of income on rent) — very limited rent-growth headroom before tenants either downsize or default.
Questions for listing agent
- What do current leases actually rent for vs. the listed asking? Can we see a recent rent roll and the last 12 months of T-12 income?
- It's been on market 94 days. Have you received any prior offers? Is the seller open to a 28% concession, seller financing, or rate buy-down credit?
- Why hasn't it sold? Are there any deal-killer items the seller is aware of (foundation, flood, title, zoning, code violations)?
- Is there a deadline driving the sale (1031 exchange, divorce, estate, relocation)? That informs how much negotiation room exists.
- Schools are D-rated, which usually means shorter tenancies and higher turnover. Who's the typical renter profile here, and what's been the actual vacancy rate?
- Crime grade is F in this area — have there been break-ins, vandalism, or insurance claims at this property in the last 3 years? What carrier currently insures it and at what premium?
- The area grade is low — what's the realistic commute time and amenity access for the typical tenant pool here? Any planned neighborhood developments (good or bad) we should know about?
- What's the average days-on-market for RENTAL listings here right now (not sales)? A rising rental-DOM trend means longer vacancies and softer asking-rent achievability than the comps imply.
CashFlowRE · CFR-V44VN106Y9KXFJ
· Data 8 h ago
cashflowre.app · 2026-05-29