6631 Foster St · Houston, TX
Flood risk No data
- FEMA flood zone
- —
- Chance of flooding over 30 yrs
- —
- Est. flood insurance / yr
- —
Fire risk No data
- Est. fire insurance / yr
- —
Heat risk No data
- Hot days now (above threshold)
- —
- Hot days in 30 yrs
- —
Wind risk No data
- Chance of severe wind over 30 yrs
- —
Air-quality risk No data
- Unhealthy air days now
- —
- Unhealthy air days in 30 yrs
- —
Risk factors via First Street. Map © Google.
Why this score? — see what drove the D- grade
The composite is a weighted blend of 9 inputs, each scored 0–100. Each bar is that input's sub-score; the figure is the points it added to the 100-point composite (weight × sub-score).
- Cash flow +10.8/30.0
- ARV discount +9.2/15.0
- Livability +3.7/5.0
- DSCR +3.1/10.0
- Rent growth +3.0/5.0
- Schools +2.7/10.0
- Condition / age +2.5/5.0
- 1% rule +2.2/10.0
- Appreciation +0.0/10.0
$309,000
🖨 Deal sheet (PDF) 📄 Offer letter ✓ Due diligence
Listing remarks MLS
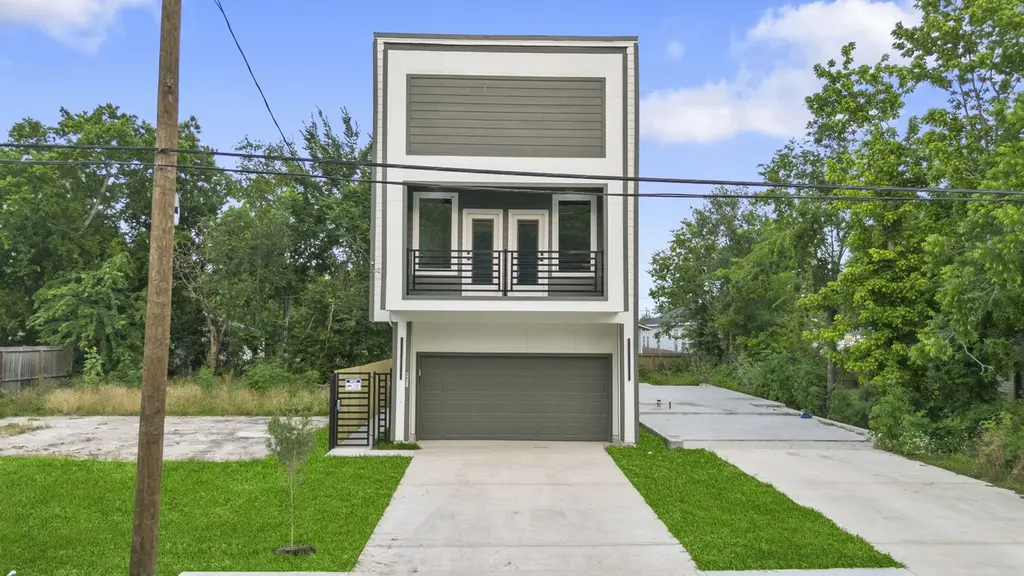
Modern 2-Story Contemporary Gem in Prime Location! Nestled in the heart of Houston with unbeatable access to Hwy 288 and the South Loop (610), this stylish 2-story contemporary home offers the perfect blend of modern finishes and functional design. Step inside to discover quartz countertops, sleek soft-close cabinetry, and a dedicated office space enclosed with elegant French doors, perfect for remote work or creative pursuits. Enjoy indoor-outdoor living with a front balcony that bring in natural light and fresh air. The backyard provides a rare find in the city, ideal for entertaining, relaxing, or even pets. With its clean lines, modern touches, and commuter-friendly location, this home checks all the boxes for comfort and convenience.
Key facts
- Front balcony
- Backyard
- 2 garage spots
Tags
Neighborhood map
What this means for you Summary
Snapshot
- This is a 3-bed/2.5-bath other listed at $309k.
Deal economics
- At list price, monthly cash flow is $-143 ($-2k/yr) — negative.
- To cash-flow at today's rent, offer at most $284k (8.2% below list).
- To meet the 1% rule (rent ≥ 1% of price), the offer needs to be $223k (27.9% below list).
- Recommended offer: $223k (27.9% below list) — sets the bar for 1% rule.
- Cap rate 5.7% vs local median 3.1% in Houston — top-decile yield for the area; either an underpriced asset or a hidden risk that comps aren't pricing in. Stress-test before assuming the spread holds.
Location & tenants
- Location reads 74/100 on livability (#184 in TX, #4,771 nationally) — a middle-class / working-renter tenant base. Strengths: amenities A+, cost of living A+, housing A+; Watch: schools D, crime F.
- Houston ISD (urban): math 27% / reading 35% proficiency, ranked #593 of 826 in TX (top 72%) — families likely to look elsewhere, expect single-tenant / working-renter base with shorter leases; 71% free/reduced lunch — lower-income household profile, screen leases tightly.
- Market conditions: Rents rising (+2.2%/yr); 467 active listings in the ZIP; 40 comparable units currently listed for rent nearby; rentals at typical pace (median 18d on market — plan ~3-4 weeks tenant-placement turnaround); 29,883 units permitted in Harris County in 2024 (8,621 in 5+ unit buildings).
- At $2,227/mo this rent would consume 59% of the median local household income ($46k/yr) (locally 2532% of renters already pay >50% of income on rent) — very limited rent-growth headroom before tenants either downsize or default.
Forward outlook
- Local home prices are declining (-3.0%/yr); year-one equity from $2k of loan paydown is wiped out by about $9k of value loss. Plan a longer hold.
- Harris County population projected at +47% by 2050 — long-run rental-demand tailwind backs the buy-and-hold thesis.
Negotiation context
- It's been on market 91 days — a 9% lower offer ($281k) is reasonable based on typical stale-listing flexibility.
- 16 sale attempts since 10y ago; this cycle's ask is 13335% above the opening price — seller raised mid-cycle; expect resistance to lowballs.
Questions for the listing agent
- What do current leases actually rent for vs. the listed asking? Can we see a recent rent roll and the last 12 months of T-12 income?
- It's been on market 91 days. Have you received any prior offers? Is the seller open to a 28% concession, seller financing, or rate buy-down credit?
- Why hasn't it sold? Are there any deal-killer items the seller is aware of (foundation, flood, title, zoning, code violations)?
- Is there a deadline driving the sale (1031 exchange, divorce, estate, relocation)? That informs how much negotiation room exists.
- Schools are D-rated, which usually means shorter tenancies and higher turnover. Who's the typical renter profile here, and what's been the actual vacancy rate?
- Crime grade is F in this area — have there been break-ins, vandalism, or insurance claims at this property in the last 3 years? What carrier currently insures it and at what premium?
- The area grade is low — what's the realistic commute time and amenity access for the typical tenant pool here? Any planned neighborhood developments (good or bad) we should know about?
- What's the average days-on-market for RENTAL listings here right now (not sales)? A rising rental-DOM trend means longer vacancies and softer asking-rent achievability than the comps imply.
- What's the recent tenant-quality profile in this submarket — average credit score on applications, eviction rate, late-payment / NSF rate, and stable-employment percentage? A property-management company in the area should have these aggregated.
- How much new for-sale + rental construction is in the pipeline within 1–3 miles? Heavy new supply typically softens prices + rents 12–24 months out; constrained supply supports both.
Investment metrics
- 1% rule
- 0.72% ✗
- Cap rate
- 5.74%
- Cash-on-cash
- -1.99%
- DSCR
- 0.91
- GRM
- 11.6
CMA / ARV
- ARV (median comp)
- $320,796
- List price
- $309,000
- Delta
- -3.68%
- Verdict
- FAIR
- Comps
- 20 within 1.0 mi
Projected returns pro-forma
-3.0% appreciation · 2.17% rent growth · sell at horizon
- IRR
- -20.5%
- Equity multiple
- 0.29×
- Total profit
- $-61,143
- Equity at exit
- $46,073
- IRR
- -15.4%
- Equity multiple
- 0.16×
- Total profit
- $-72,872
- Equity at exit
- $26,717
Cash invested: $86,520 (down + closing). Projections, not guarantees.
Landlord ↔ Tenant lean methodology
- Overall (STATE)
- 87 Strongly Landlord-Friendly
- State Texas
- 87 Strongly Landlord-Friendly · R+5
- County
- — inherits STATE
- City
- — inherits STATE
ZIP-level market 77021
- Home prices YoY
- -23.6%
- Rents YoY
- 2.2%
- Active inventory
- 467
- Price-to-rent
- 11.6×
Monthly cashflow live
- Estimated rent
- $2,227 high interval (Pro) →
- Mortgage (P&I)
- −$1,620
- Tax from tax record
- −$153 /mo · $1,841/yr
- Insurance
- −$129
- HOA
- −$0
- Vacancy / Maint / Mgmt
- −$468
- Net cashflow
- $-143
Break-even live
Sensitivity live
| Price | -10% $32 | -5% $-56 | +0% $-143 | +5% $-231 | +10% $-318 |
|---|---|---|---|---|---|
| Rent | -10% $-319 | -5% $-231 | +0% $-143 | +5% $-55 | +10% $33 |
| Rate | -1.0pp $12 | -0.5pp $-65 | base $-143 | +0.5pp $-223 | +1.0pp $-305 |
UW: 25.0% down · 7.5% · 30yr · 1.5% tax · 5.0% vac · 8.0% maint · 8.0% mgmt
Financing live
Cash to close
- Down payment
- $77,250
- Closing costs
- $9,270
- Reserves months
- —
- Total cash needed
- —
Loan-product check · same deal, 3 products live
Conventional
25% down · 7.5% · 30yr
- Down + closing
- —
- Monthly P&I
- —
- Monthly cashflow
- —
- DSCR
- —
- Eligible?
- —
Personal DTI + credit; lowest rate.
DSCR
20% down · 8.5% · 30yr
- Down + closing
- —
- Monthly P&I
- —
- Monthly cashflow
- —
- DSCR
- —
- Eligible?
- —
No personal income docs; deal must DSCR.
Hard money
10% down · 12.0% · 12mo
- Down + closing
- —
- Monthly P&I
- —
- Monthly cashflow
- —
- DSCR
- —
- Eligible?
- —
Short-term bridge; refi at stabilization.
Rent comps 40 comps
| Address | Beds | Baths | Sqft | Rent | $/sqft | DOM | Units | Dist |
|---|---|---|---|---|---|---|---|---|
| 6731 New York St Houston, TX | 3.0 | 3.0 | 2211 | $2,100 | $0.95 | 44d | 1 | 0.22mi |
| 6809 Conley St Houston, TX | 3.0 | 4.0 | 1921 | $2,600 | $1.35 | 44d | 1 | 0.29mi |
| 6926 Paris St Houston, TX | 3.0 | 2.0 | 1276 | $1,900 | $1.49 | 0d | 1 | 0.37mi |
| 6928 Paris St Houston, TX | 3.0 | 2.0 | 1276 | $1,900 | $1.49 | 0d | 1 | 0.38mi |
| 4705 Idaho St Houston, TX | 3.0 | 2.5 | 1664 | $2,500 | $1.50 | 17d | 1 | 0.38mi |
| 6532 Weston St Unit A Houston, TX | 3.0 | 3.0 | 1484 | $2,200 | $1.48 | 18d | 1 | 0.45mi |
| 6528 Weston St Unit A Houston, TX | 3.0 | 3.0 | 1484 | $2,200 | $1.48 | 44d | 1 | 0.46mi |
| 6528 Weston St Unit A Houston, TX | 3.0 | 3.0 | 1484 | $2,200 | $1.48 | 0d | 1 | 0.46mi |
| 6109 Wayland St Houston, TX | 4.0 | 2.0 | 1600 | $1,595 | $1.00 | 0d | 1 | 0.66mi |
| 4135 DuPont St Houston, TX | 3.0 | 4.0 | 2395 | $2,499 | $1.04 | 44d | 1 | 0.69mi |
| 3731 Alsace St Unit 1560804P Houston, TX | 3.0 | 2.0 | 2002 | $3,387 | $1.69 | 3d | 1 | 0.69mi |
| 5813 England St Unit A Houston, TX | 3.0 | 2.5 | 1473 | $2,195 | $1.49 | 4d | 1 | 0.71mi |
| 7321 Conley St Unit B Houston, TX | 3.0 | 2.0 | 1501 | $2,025 | $1.35 | 21d | 1 | 0.75mi |
| 7321 Conley St Unit A Houston, TX | 3.0 | 2.5 | 1869 | $2,025 | $1.08 | 21d | 1 | 0.75mi |
| 4942 Bataan Rd Unit 77033 Houston, TX | 4.0 | 2.0 | 1350 | $1,800 | $1.33 | 44d | 1 | 0.84mi |
| 3846 Seabrook St Houston, TX | 3.0 | 3.5 | 1833 | $2,300 | $1.25 | 44d | 1 | 0.89mi |
| 5123 Dewberry St Houston, TX | 4.0 | 2.0 | 1391 | $2,400 | $1.73 | 44d | 1 | 0.91mi |
| 3615 Dreyfus St Houston, TX | 3.0 | 3.0 | 2011 | $2,800 | $1.39 | 44d | 1 | 0.95mi |
| 3732 Seabrook St Houston, TX | 3.0 | 2.5 | 1727 | $2,350 | $1.36 | 25d | 1 | 0.98mi |
| 3655 Seabrook St Unit 6 Houston, TX | 2.0 | 1.0 | 1600 | $1,000 | $0.62 | 44d | 1 | 0.99mi |
| 7358 Guadalcanal Rd Houston, TX | 3.0 | 3.0 | 1768 | $2,195 | $1.24 | 44d | 1 | 1.01mi |
| 3560 Dixie Dr Apt 422 Houston, TX | 2.0 | 2.0 | 1322 | $1,410 | $1.07 | 8d | 1 | 1.03mi |
| 3560 Dixie Dr Unit 3617 Houston, TX | 2.0 | 2.0 | 1322 | $1,435 | $1.09 | 44d | 1 | 1.03mi |
| 3560 Dixie Dr Unit 3597 Houston, TX | 2.0 | 2.0 | 1322 | $1,434 | $1.08 | 11d | 1 | 1.03mi |
| 3560 Dixie Dr Unit 2162 Houston, TX | 2.0 | 2.0 | 1322 | $1,410 | $1.07 | 6d | 1 | 1.03mi |
| 3560 Dixie Dr Unit 2165 Houston, TX | 2.0 | 2.0 | 1322 | $1,440 | $1.09 | 0d | 1 | 1.03mi |
| 3644 Griggs Rd Unit 1047940P Houston, TX | 3.0 | 2.5 | 1399 | $2,161 | $1.54 | 2d | 1 | 1.04mi |
| 4530 Mayflower St Houston, TX | 3.0 | 2.0 | 1302 | $1,800 | $1.38 | 44d | 1 | 1.08mi |
| 4907 Culmore Dr Houston, TX | 4.0 | 2.0 | 1800 | $2,700 | $1.50 | 17d | 1 | 1.09mi |
| 5317 Chennault Rd Unit A Houston, TX | 3.0 | 2.5 | 1608 | $1,999 | $1.24 | 44d | 1 | 1.09mi |
| 6336 Culberson St Houston, TX | 3.0 | 3.5 | 1822 | $2,361 | $1.30 | 6d | 1 | 1.10mi |
| 6334 Culberson St Houston, TX | 3.0 | 3.5 | 1822 | $2,311 | $1.27 | 2d | 1 | 1.11mi |
| 5154 Griggs Rd Unit CAVE Houston, TX | 2.0 | 2.0 | 1322 | $1,420 | $1.07 | 3d | 1 | 1.11mi |
| 6737 Peerless St Unit A Houston, TX | 3.0 | 3.5 | 1732 | $2,649 | $1.53 | 17d | 1 | 1.16mi |
| 6735 Peerless St Unit CUNIT A Houston, TX | 3.0 | 3.5 | 1732 | $2,649 | $1.53 | 17d | 1 | 1.16mi |
| 6735c Peerless St Houston, TX | 3.0 | 3.5 | 1732 | $2,599 | $1.50 | 0d | 1 | 1.17mi |
| 3311 Daphne St Unit 1255369P Houston, TX | 3.0 | 3.5 | 1797 | $6,357 | $3.54 | 0d | 1 | 1.19mi |
| 3311 Daphne St Unit 3311 Houston, TX | 3.0 | 3.5 | 1800 | $7,500 | $4.17 | 44d | 1 | 1.19mi |
| 7339 Krueger Rd Houston, TX | 3.0 | 2.0 | 2440 | $1,900 | $0.78 | 44d | 1 | 1.20mi |
| 4907 Marietta Ln Unit 1494902P Houston, TX | 3.0 | 2.0 | 1593 | $3,278 | $2.06 | 14d | 1 | 1.28mi |
Listing history 50 events
-
2026-06-18days on market $309,000 Active 91 DOM
-
2026-06-17days on market $309,000 Active 90 DOM
-
2026-06-16days on market $309,000 Active 89 DOM
-
2026-06-15days on market $309,000 Active 88 DOM
-
2026-06-13days on market $309,000 Active 86 DOM
-
2026-06-10days on market $309,000 Active 82 DOM
-
2026-06-08days on market $309,000 Active 81 DOM
-
2026-06-07days on market $309,000 Active 80 DOM
-
2026-06-04days on market $309,000 Active 77 DOM
-
2026-06-01days on market $309,000 Active 74 DOM
-
2026-05-31days on market $309,000 Active 73 DOM
-
2026-05-11$2,300
-
2026-05-10historical $2,300
-
2026-05-08$2,300
-
2026-05-08historical $2,300
-
2026-05-06price $309,000 759-char remark
Show marketing remark (759 chars)
Modern 2-Story Contemporary Gem in Prime Location! Nestled in the heart of Houston with unbeatable access to Hwy 288 and the South Loop (610), this stylish 2-story contemporary home offers the perfect blend of modern finishes and functional design. Step inside to discover quartz countertops, sleek soft-close cabinetry, and a dedicated office space enclosed with elegant French doors, perfect for remote work or creative pursuits. Enjoy indoor-outdoor living with a front balcony that bring in natural light and fresh air. The backyard provides a rare find in the city, ideal for entertaining, relaxing, or even pets. With its clean lines, modern touches, and commuter-friendly location, this home checks all the boxes for comfort and convenience.
-
2026-03-21$2,300
-
2026-03-20price $315,000 759-char remark
Show marketing remark (759 chars)
Modern 2-Story Contemporary Gem in Prime Location! Nestled in the heart of Houston with unbeatable access to Hwy 288 and the South Loop (610), this stylish 2-story contemporary home offers the perfect blend of modern finishes and functional design. Step inside to discover quartz countertops, sleek soft-close cabinetry, and a dedicated office space enclosed with elegant French doors, perfect for remote work or creative pursuits. Enjoy indoor-outdoor living with a front balcony that bring in natural light and fresh air. The backyard provides a rare find in the city, ideal for entertaining, relaxing, or even pets. With its clean lines, modern touches, and commuter-friendly location, this home checks all the boxes for comfort and convenience.
-
2026-03-20historical $2,500
Show marketing remark (759 chars)
Modern 2-Story Contemporary Gem in Prime Location! Nestled in the heart of Houston with unbeatable access to Hwy 288 and the South Loop (610), this stylish 2-story contemporary home offers the perfect blend of modern finishes and functional design. Step inside to discover quartz countertops, sleek soft-close cabinetry, and a dedicated office space enclosed with elegant French doors, perfect for remote work or creative pursuits. Enjoy indoor-outdoor living with a front balcony that bring in natural light and fresh air. The backyard provides a rare find in the city, ideal for entertaining, relaxing, or even pets. With its clean lines, modern touches, and commuter-friendly location, this home checks all the boxes for comfort and convenience.
-
2026-03-19$335,000 Active 759-char remark
Show marketing remark (759 chars)
Modern 2-Story Contemporary Gem in Prime Location! Nestled in the heart of Houston with unbeatable access to Hwy 288 and the South Loop (610), this stylish 2-story contemporary home offers the perfect blend of modern finishes and functional design. Step inside to discover quartz countertops, sleek soft-close cabinetry, and a dedicated office space enclosed with elegant French doors, perfect for remote work or creative pursuits. Enjoy indoor-outdoor living with a front balcony that bring in natural light and fresh air. The backyard provides a rare find in the city, ideal for entertaining, relaxing, or even pets. With its clean lines, modern touches, and commuter-friendly location, this home checks all the boxes for comfort and convenience.
-
2026-03-19historical
Show marketing remark (759 chars)
Modern 2-Story Contemporary Gem in Prime Location! Nestled in the heart of Houston with unbeatable access to Hwy 288 and the South Loop (610), this stylish 2-story contemporary home offers the perfect blend of modern finishes and functional design. Step inside to discover quartz countertops, sleek soft-close cabinetry, and a dedicated office space enclosed with elegant French doors, perfect for remote work or creative pursuits. Enjoy indoor-outdoor living with a front balcony that bring in natural light and fresh air. The backyard provides a rare find in the city, ideal for entertaining, relaxing, or even pets. With its clean lines, modern touches, and commuter-friendly location, this home checks all the boxes for comfort and convenience.
-
2026-01-13$2,500
-
2026-01-06$355,000 Active
-
2025-12-29historical $3,000
-
2025-11-30historical
-
2025-11-06$3,000
-
2025-08-05$349,900 Active
-
2025-08-05historical
-
2025-05-22$364,999 Active
-
2023-02-07soldstatus
-
2023-01-04soldstatus
-
2020-06-16soldstatus
-
2019-03-07soldstatus
-
2019-02-28soldstatus Sold
-
2019-01-02status Active
-
2018-12-31historical
-
2018-09-29price $35,000
-
2018-09-18$40,000 Active
-
2018-06-30historical
-
2018-04-10price $45,000
-
2018-03-05$50,000 Active
-
2017-10-13soldstatus
-
2017-10-11soldstatus Sold
-
2017-08-10status Pending
-
2017-07-25price $19,500
-
2017-06-25$24,500 Active
-
2017-02-09historical
-
2016-11-23$24,000 Active
-
2016-09-08soldstatus
-
2016-09-04status Pending
ⓘ Source: listings_history table (triggers on properties + properties_extension) + one-shot
backfill from property_details.listing_events for pre-trigger history.
Tax reassessment forecast TX · Resets to sale price
- Current annual tax
- $1,841 · $153/mo
- Projected year-2 tax
- $5,655 · $471/mo
- Expected delta
- +$3,814/yr (+$318/mo · 207.2%)
ⓘ Screening estimate from a state-policy table — verify with the county assessor before closing.
Nearby sold comps map
Loading sold comps map…
Walkable amenities ~0.75 mi
Loading nearby amenities…
Taxation est. · year 1
- Rental income
- $26,725
- − Mortgage interest
- −$17,309
- − Property taxes
- −$1,841
- − Insurance
- −$1,545
- − Repairs & maintenance
- −$2,138
- − Management
- −$2,138
- − Depreciation
- −$8,989
- Taxable loss
- −$7,234
- Est. tax savings @ 24.0%
- +$1,736
- After-tax cash flow
- $18/yr
For passive investors: Depreciation is non-cash, so a rental often shows a tax loss while cash-flowing — sheltering income. Rental losses are passive: they offset passive income freely, and up to $25,000/yr can offset ordinary (W-2) income if you actively participate and your MAGI is under $100k (phasing out to $0 by $150k); unused losses carry forward. On sale, claimed depreciation is recaptured at up to 25%, and gains may owe capital-gains tax (a 1031 exchange can defer both). Figures are a year-1 estimate at your 24.0% rate — not tax advice; consult a CPA.
Schools (NCES district)
- District
- Houston ISD
- NCES district ID
- 4823640
- Math proficiency
- 27% ▼ -18.00%
- Reading proficiency
- 35% ▼ -6.00%
- Median HH income
- $46,054
- Composite
- 26.63/100
- National rank
- #7173
- State rank
- #593 of 826 in TX
Livability — Houston
- Score
- 74/100
- State rank
- #184
- US rank
- #4771
Category grades
Schools grade is shown separately in the Schools card above.
Census & demographics
- Census place
- Houston, TX
- County
- Harris County · 4,702,590 people
- City population
- 3,226,434
- Metro
- Houston-The Woodlands-Sugar Land, TX
- Population (ZIP)
- 26,153
- Household income
- $45,574
- Rent vs Own
- Severe rent burden
- 2532.0
Population outlook (Harris County) Hauer SSP2
- Today (2025)
- 5,571,493 people
- By 2030
- 6,089,821 · +9.3%
- By 2040
- 7,142,806 · +28.2%
- By 2050
- 8,185,864 · +46.9%
- By 2075
- 10,574,329 · +89.8%
- By 2100
- 12,109,958 · +117.4%
Race, ethnicity, and origin ACS 2023
- Neighborhood character
- Diverse neighborhood (Simpson 0.55)
- Race & ethnicity
- Black 62% Hispanic / Latino 22% Two or more races 12% White 10% Asian 2%
- Hispanic origin (detail)
- Mexican 15%
- Common ancestry
- Italian 1% Romanian 1% Lithuanian 1%
- Foreign-born
- 11% · Canada
- Languages at home
- 77% English-only · Spanish 19% French/Haitian/Cajun 1% Other Indo-European 1%
Political lean MEDSL · Harris
- 2024 margin
- Lean D (+5.5) · D 52.0% · R 46.4% · Other 1.6%
- 2008→2024 swing
- +3.9pp toward D · 2008: 1.6pp · 2024: 5.5pp
- All cycles
- 2024: D+5.5 2020: D+13.3 2016: D+12.4 2012: D+0.1 2008: D+1.6
Not yet ingested
- Civics
- —
Market trends
- HPI YoY
- ▼ -71.22%
- Current HPI
- 230.2869
- Rent YoY
- ▲ 2.17%
- Metro
- Houston-The Woodlands-Sugar Land, TX
- State GDP YoY
- ▲ 3.95%
- F500 in state
- 110
Industry mix (Fortune 500 HQ in TX)
| Industry | F500 HQs | Revenue |
|---|---|---|
| Energy | 16 | $1,198B |
|
||
| Technology | 5 | $198B |
|
||
| Engineering / Construction | 4 | $72B |
|
||
| Energy Services | 3 | $60B |
|
||
| Utilities | 3 | $41B |
|
||
| Healthcare | 2 | $330B |
|
||
Price history
-90.8% since first listed45 events — show timeline
- 2026-05-11 Listed for Rent $2,300 HARMLS
- 2026-05-10 Rental Removed $2,300 RENTSPREE
- 2026-05-08 Listed for Rent $2,300 RENTSPREE
- 2026-05-08 Rental Removed $2,300 HARMLS
- 2026-05-06 Price Changed $309,000 HARMLS
- 2026-03-21 Listed for Rent $2,300 HARMLS
- 2026-03-20 Price Changed $315,000 HARMLS
- 2026-03-20 Rental Removed $2,500 HARMLS
- 2026-03-19 Listing Removed — HARMLS
- 2026-03-19 Listed $335,000 HARMLS
- 2026-01-13 Listed for Rent $2,500 HARMLS
- 2026-01-06 Listed $355,000 HARMLS
- 2025-12-29 Rental Removed $3,000 HARMLS
- 2025-11-30 Listing Removed — HARMLS
- 2025-11-06 Listed for Rent $3,000 HARMLS
- 2025-08-05 Listing Removed — HARMLS
- 2025-08-05 Listed $349,900 HARMLS
- 2025-05-22 Listed $364,999 HARMLS
- 2023-02-07 Sold (Public Records) — Public Records
- 2023-01-04 Sold (Public Records) — Public Records
- 2020-06-16 Sold (Public Records) — Public Records
- 2019-03-07 Sold (Public Records) — Public Records
- 2019-02-28 Sold (MLS) — HARMLS
- 2019-01-02 Relisted — HARMLS
- 2018-12-31 Listing Removed — HARMLS
- 2018-09-29 Price Changed $35,000 HARMLS
- 2018-09-18 Listed $40,000 HARMLS
- 2018-06-30 Listing Removed — HARMLS
- 2018-04-10 Price Changed $45,000 HARMLS
- 2018-03-05 Listed $50,000 HARMLS
- 2017-10-13 Sold (Public Records) — Public Records
- 2017-10-11 Sold (MLS) — HARMLS
- 2017-08-10 Pending — HARMLS
- 2017-07-25 Price Changed $19,500 HARMLS
- 2017-06-25 Listed $24,500 HARMLS
- 2017-02-09 Listing Removed — HARMLS
- 2016-11-23 Listed $24,000 HARMLS
- 2016-09-08 Sold (Public Records) — Public Records
- 2016-09-04 Pending — HARMLS
- 2016-08-31 Listing Removed — HARMLS
- 2016-08-18 Price Changed $19,500 HARMLS
- 2016-08-10 Listed $25,000 HARMLS
- 2016-08-09 Listing Removed — HARMLS
- 2016-08-05 Listed $25,000 HARMLS
- 1988-11-17 Sold (Public Records) — Public Records
Property tax history
+8.9%/yrLatest (2023): $1,841 · +17.6% YoY. Source: county tax records.
Cash-flow waterfall
monthlySold comps — $/sqft
last 12 mo · ≤1 miLoading sold comps…