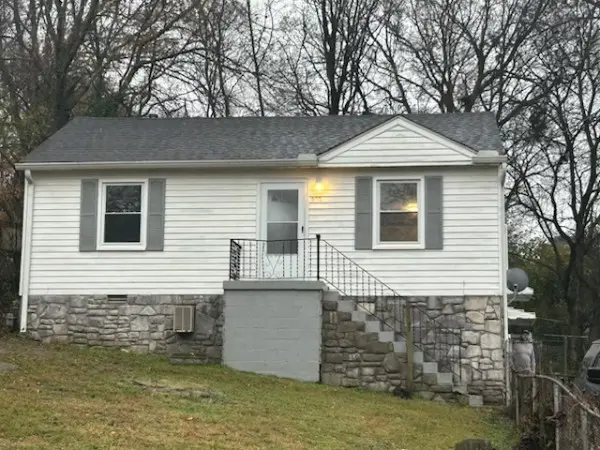
930 Sharpe Ave
Nashville-Davidson metropolitan government (balance), TN 37206
$325,000C+
5 bd · 1.0 ba ·
1,728 sqft ·
Built 1960
· SingleFamily
· Pending
· 29 DOM
Cashflow @ list (25.0% down · 7.5%)
Estimated rent
$3,422/mo
Mortgage (P&I)
−$1,704
Tax + insurance
−$401
HOA
−$0
Vac / Maint / Mgmt
−$719
Net cashflow
$598/mo
Annual
$7,175/yr
Cap rate
8.71%
Cash-on-cash
8.62%
DSCR
1.38
1% rule
1.05%
Cash to close
$91,000
Investor read
- This is a 5-bed/1.0-bath single-family listed at $325k.
- At list price, monthly cash flow is $598 ($7k/yr) — positive.
- The deal already cash-flows at list — no discount required.
- Meets the 1% rule at list price ($3k rent vs $325k).
- It's been on market 29 days — a 2% lower offer ($320k) is reasonable based on typical stale-listing flexibility.
- Recommended offer: $320k (1.5% below list) — sets the bar for market timing.
- Local home prices are declining (-3.0%/yr); year-one equity from $2k of loan paydown is wiped out by about $10k of value loss. Plan a longer hold.
- Location reads: area grade C — affects rentability + tenant quality, not the cash-flow math above.
- Davidson County (urban): math 12% / reading 19% proficiency, ranked #126 of 139 in TN (top 91%) — low school quality limits family demand, transient renter base, plan for 1-2y turnover; 66% free/reduced lunch — lower-income household profile, screen leases tightly.
- Zoned schools: Hattie Cotton Elementary (math 2% / reading 2%, grade F, #926 of 952 statewide, top 100%, 249 students, 0% FRL); Maplewood High (math 2% / reading 12%, grade F, #294 of 332 statewide, top 91%, 691 students, 0% FRL) — zoned schools average 0% FRL vs 66% district-wide (66 pts lower); this property's tenant base skews higher-income than the district average.
- Watch-outs: flood insurance adds $56/mo.
- Market conditions: Rents rising (+1.5%/yr); 289 active listings in the ZIP; 15 comparable units currently listed for rent nearby; rentals at typical pace (median 14d on market — plan ~3-4 weeks tenant-placement turnaround); solid renter incomes; 6,873 units permitted in Davidson County in 2024 (4,138 in 5+ unit buildings).
- Davidson County population projected at +42% by 2050 — long-run rental-demand tailwind backs the buy-and-hold thesis.
- 6 sale attempts since 10y ago with the ask held roughly flat each time — persistent listings suggest the price (not the market) is what's stuck; bring a comps-based counter.
- Climate carrying-cost: severe flood risk; extreme-heat days projected 7→20/yr by 2055 (HVAC capex compounding) — expect insurance premiums to compound above CPI over the hold.
- Cap rate 8.7% vs local median 2.9% in Nashville-Davidson metropolitan government (balance) — top-decile yield for the area; either an underpriced asset or a hidden risk that comps aren't pricing in. Stress-test before assuming the spread holds.
- This rent runs 43% of the median local income ($96k/yr) — at the standard rent-burdened threshold; future hikes will face affordability resistance.
Questions for listing agent
- Built in 1960 — when were the roof, HVAC, electrical panel, plumbing, and water heater last replaced?
- What's the actual annual flood-insurance premium (NFIP or private), and is the property in a SFHA with mandatory coverage?
- Is there a deadline driving the sale (1031 exchange, divorce, estate, relocation)? That informs how much negotiation room exists.
- What's the average days-on-market for RENTAL listings here right now (not sales)? A rising rental-DOM trend means longer vacancies and softer asking-rent achievability than the comps imply.
- What's the recent tenant-quality profile in this submarket — average credit score on applications, eviction rate, late-payment / NSF rate, and stable-employment percentage? A property-management company in the area should have these aggregated.
- How much new for-sale + rental construction is in the pipeline within 1–3 miles? Heavy new supply typically softens prices + rents 12–24 months out; constrained supply supports both.
CashFlowRE · CFR-V4SCR15MXW2DPV
· Data 3 weeks ago
cashflowre.app · 2026-05-29