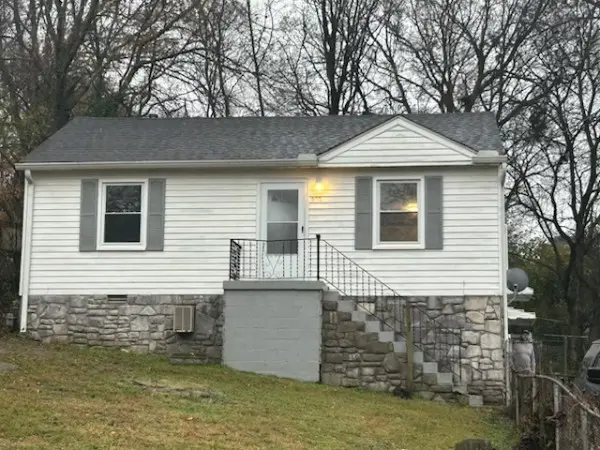
930 Sharpe Ave · Nashville-Davidson metropolitan government (balance), TN
Flood risk 9/10 · Severe
- FEMA flood zone
- X (unshaded)
- Chance of flooding over 30 yrs
- 0.99%
- Est. flood insurance / yr
- $473 – $860
Fire risk 1/10 · Minimal
- Est. fire insurance / yr
- $949 – $1,763
Heat risk 6/10 · Moderate
- Hot days now (above 105°F)
- 7 days/yr
- Hot days in 30 yrs
- 20 days/yr
Wind risk 4/10 · Minor
- Chance of severe wind over 30 yrs
- 9.0%
Air-quality risk 2/10 · Minimal
- Unhealthy air days now
- 1 days/yr
- Unhealthy air days in 30 yrs
- 2 days/yr
Risk factors via First Street. Map © Google.
Why this score? — see what drove the C+ grade
The composite is a weighted blend of 9 inputs, each scored 0–100. Each bar is that input's sub-score; the figure is the points it added to the 100-point composite (weight × sub-score).
- Cash flow +24.3/30.0
- ARV discount +15.0/15.0
- DSCR +7.8/10.0
- 1% rule +5.5/10.0
- Rent growth +2.9/5.0
- Livability +2.5/5.0
- Condition / age +2.5/5.0
- Schools +1.4/10.0
- Appreciation +0.0/10.0
$325,000
🖨 Deal sheet 📄 Offer letter ✓ Due diligence
Key facts
- 8,276 sq ft lot
- 2 parking spots
- Built 1960
Neighborhood map
What this means for you Summary
Snapshot
- This is a 5-bed/1.0-bath single-family listed at $325k.
Deal economics
- At list price, monthly cash flow is $598 ($7k/yr) — positive.
- The deal already cash-flows at list — no discount required.
- Meets the 1% rule at list price ($3k rent vs $325k).
- Recommended offer: $320k (1.5% below list) — sets the bar for market timing.
- Cap rate 8.7% vs local median 2.9% in Nashville-Davidson metropolitan government (balance) — top-decile yield for the area; either an underpriced asset or a hidden risk that comps aren't pricing in. Stress-test before assuming the spread holds.
Location & tenants
- Location reads: area grade C — affects rentability + tenant quality, not the cash-flow math above.
- Davidson County (urban): math 12% / reading 19% proficiency, ranked #126 of 139 in TN (top 91%) — low school quality limits family demand, transient renter base, plan for 1-2y turnover; 66% free/reduced lunch — lower-income household profile, screen leases tightly.
- Zoned schools: Hattie Cotton Elementary (math 2% / reading 2%, grade F, #926 of 952 statewide, top 100%, 249 students, 0% FRL); Maplewood High (math 2% / reading 12%, grade F, #294 of 332 statewide, top 91%, 691 students, 0% FRL) — zoned schools average 0% FRL vs 66% district-wide (66 pts lower); this property's tenant base skews higher-income than the district average.
- Market conditions: Rents rising (+1.5%/yr); 289 active listings in the ZIP; 15 comparable units currently listed for rent nearby; rentals leasing fast (median 14d on market — plan ~1-2 weeks tenant-placement turnaround); solid renter incomes; 6,873 units permitted in Davidson County in 2024 (4,138 in 5+ unit buildings).
- This rent runs 43% of the median local income ($96k/yr) — at the standard rent-burdened threshold; future hikes will face affordability resistance.
Forward outlook
- Local home prices are declining (-3.0%/yr); year-one equity from $2k of loan paydown is wiped out by about $10k of value loss. Plan a longer hold.
- Davidson County population projected at +42% by 2050 — long-run rental-demand tailwind backs the buy-and-hold thesis.
Negotiation context
- It's been on market 29 days — a 2% lower offer ($320k) is reasonable based on typical stale-listing flexibility.
- 6 sale attempts since 10y ago with the ask held roughly flat each time — persistent listings suggest the price (not the market) is what's stuck; bring a comps-based counter.
Risks & watch-outs
- Watch-outs: flood insurance adds $56/mo.
- Climate carrying-cost: severe flood risk; extreme-heat days projected 7→20/yr by 2055 (HVAC capex compounding) — expect insurance premiums to compound above CPI over the hold.
Questions for the listing agent
- Built in 1960 — when were the roof, HVAC, electrical panel, plumbing, and water heater last replaced?
- What's the actual annual flood-insurance premium (NFIP or private), and is the property in a SFHA with mandatory coverage?
- Is there a deadline driving the sale (1031 exchange, divorce, estate, relocation)? That informs how much negotiation room exists.
- What's the average days-on-market for RENTAL listings here right now (not sales)? A rising rental-DOM trend means longer vacancies and softer asking-rent achievability than the comps imply.
- What's the recent tenant-quality profile in this submarket — average credit score on applications, eviction rate, late-payment / NSF rate, and stable-employment percentage? A property-management company in the area should have these aggregated.
- How much new for-sale + rental construction is in the pipeline within 1–3 miles? Heavy new supply typically softens prices + rents 12–24 months out; constrained supply supports both.
Investment metrics
- 1% rule
- 1.05% ✓
- Cap rate
- 8.71%
- Cash-on-cash
- 8.62%
- DSCR
- 1.38
- GRM
- 7.9
CMA / ARV
- ARV (on-the-fly)
- $502,848
- Comps found
- 11
Show comp detail 11 sales within ~0.75 mi
| Address | Dist | Beds/Ba | Sqft | Sold | Price | $/sf | Match |
|---|---|---|---|---|---|---|---|
| 1021 Granada Ave | 0.19mi | 4/1.0 (-1) | 1,620 (-6%) | 2mo | $415,000 | $256 | 74 |
| 896 W Sharpe Ave | 0.12mi | 5/2.0 | 1,662 (-4%) | 21mo | $393,000 | $236 | 67 |
| 1010 N 6th St | 0.53mi | 4/2.0 (-1) | 1,725 (-0%) | 15mo | $399,900 | $232 | 54 |
| 906 N 14th St | 0.54mi | 4/2.0 (-1) | 1,670 (-3%) | 10mo | $735,000 | $440 | 52 |
| 1022 North 5th St | 0.60mi | 4/3.0 (-1) | 1,800 (+4%) | 4mo | $687,500 | $382 | 49 |
| 1003 N 5th St | 0.58mi | 4/2.0 (-1) | 1,835 (+6%) | 9mo | $680,000 | $371 | 46 |
| 708 Hart Ave | 0.50mi | 4/2.0 (-1) | 1,830 (+6%) | 14mo | $610,000 | $333 | 46 |
| 1109 N 6th St | 0.49mi | 4/2.5 (-1) | 1,936 (+12%) | 2mo | $650,000 | $336 | 44 |
| 824 N 5th St | 0.68mi | 4/2.5 (-1) | 1,584 (-8%) | 7mo | $435,000 | $275 | 37 |
| 1516 Montgomery Ave | 0.66mi | 4/2.0 (-1) | 1,889 (+9%) | 14mo | $550,000 | $291 | 33 |
| 1320 N 5th St | 0.68mi | 4/3.0 (-1) | 1,915 (+11%) | 14mo | $550,000 | $287 | 25 |
Match score weights: distance 35% · size 25% · config 20% · recency 20%. Top-matched comps best support the ARV.
Projected returns pro-forma
-3.0% appreciation · 1.53% rent growth · sell at horizon
- IRR
- -5.9%
- Equity multiple
- 0.78×
- Total profit
- $-19,608
- Equity at exit
- $48,459
- IRR
- 2.0%
- Equity multiple
- 1.13×
- Total profit
- $11,946
- Equity at exit
- $28,100
Cash invested: $91,000 (down + closing). Projections, not guarantees.
Landlord ↔ Tenant lean methodology
- Overall (STATE)
- 87 Strongly Landlord-Friendly
- State Tennessee
- 87 Strongly Landlord-Friendly · R+13
- County
- — inherits STATE
- City
- — inherits STATE
ZIP-level market 37206
- Rents YoY
- 1.5%
- Active inventory
- 289
- Price-to-rent
- 7.9×
Monthly cashflow live
- Estimated rent
- $3,422 high interval (Pro) →
- Mortgage (P&I)
- −$1,704
- Tax from tax record
- −$210 /mo · $2,519/yr
- Insurance
- −$135
- Flood insurance flood zone
- −$56 /mo · $666/yr
- HOA
- −$0
- Vacancy / Maint / Mgmt
- −$719
- Net cashflow
- $598
Break-even live
UW: 25.0% down · 7.5% · 30yr · 1.5% tax · 5.0% vac · 8.0% maint · 8.0% mgmt
Financing live
Cash to close
- Down payment
- $81,250
- Closing costs
- $9,750
- Reserves months
- —
- Total cash needed
- —
Loan-product check · same deal, 3 products live
Conventional
25% down · 7.5% · 30yr
- Down + closing
- —
- Monthly P&I
- —
- Monthly cashflow
- —
- DSCR
- —
- Eligible?
- —
Personal DTI + credit; lowest rate.
DSCR
20% down · 8.5% · 30yr
- Down + closing
- —
- Monthly P&I
- —
- Monthly cashflow
- —
- DSCR
- —
- Eligible?
- —
No personal income docs; deal must DSCR.
Hard money
10% down · 12.0% · 12mo
- Down + closing
- —
- Monthly P&I
- —
- Monthly cashflow
- —
- DSCR
- —
- Eligible?
- —
Short-term bridge; refi at stabilization.
Rent comps 15 comps
| Address | Beds | Baths | Sqft | Rent | $/sqft | DOM | Units | Dist |
|---|---|---|---|---|---|---|---|---|
| 738 Douglas Ave Unit 1051756P Nashville, TN | 4.0 | 3.0 | 1969 | $7,391 | $3.75 | 16d | 1 | 0.30mi |
| 1036 Seymour Ave Unit B Nashville, TN | 4.0 | 2.0 | 2000 | $2,695 | $1.35 | 4d | 1 | 0.34mi |
| 1005 W Eastland Ave Nashville, TN | 4.0 | 2.5 | 2200 | $3,850 | $1.75 | 7d | 1 | 0.39mi |
| 402 Cleveland St Unit 1312354P Nashville, TN | 4.0 | 4.5 | 2174 | $7,677 | $3.53 | 7d | 1 | 0.71mi |
| 1002 Fairwin Ave Unit 1 Nashville, TN | 4.0 | 2.0 | 1442 | $3,300 | $2.29 | 23d | 1 | 0.74mi |
| 1121 Cahal Ave Nashville, TN | 4.0 | 3.5 | 2000 | $2,995 | $1.50 | 2d | 1 | 0.81mi |
| 206 N 9th St Unit D Nashville, TN | 4.0 | 4.0 | 2000 | $4,123 | $2.06 | 2d | 1 | 0.85mi |
| 921 Spain Ave Nashville, TN | 4.0 | 3.0 | 1850 | $3,250 | $1.76 | 13d | 1 | 0.91mi |
| 504 Edwin St #18 Nashville, TN | 4.0 | 3.5 | 2002 | $3,495 | $1.75 | 23d | 1 | 0.96mi |
| 504 Edwin St #18 Nashville, TN | 4.0 | 3.5 | 2002 | $3,495 | $1.75 | 3d | 1 | 0.96mi |
| 121 Lucile St Nashville, TN | 4.0 | 4.5 | 2203 | $3,573 | $1.62 | 23d | 1 | 1.09mi |
| 203 Treutland Ave Unit A Nashville, TN | 4.0 | 2.0 | 1476 | $2,195 | $1.49 | 20d | 1 | 1.27mi |
| 115 Elmhurst Ave Nashville, TN | 4.0 | 3.0 | 2016 | $3,995 | $1.98 | 23d | 1 | 1.27mi |
| 115 Elmhurst Ave Nashville, TN | 4.0 | 3.0 | 2016 | $3,995 | $1.98 | 14d | 1 | 1.27mi |
| 801 Shelby Ave Nashville, TN | 4.0 | 2.0 | 1857 | $4,200 | $2.26 | 7d | 1 | 1.38mi |
Listing history 21 events
-
2026-05-04soldstatus $325,000
-
2026-04-15status Pending
-
2026-03-17$325,000 Active
-
2026-01-20status Pending
-
2026-01-20historical
-
2026-01-17$299,000 Active
-
2017-12-14historical
-
2017-10-17price $247,500
-
2017-10-02price $248,500
-
2017-08-31price $249,900
-
2017-08-09price $264,900
-
2017-08-02price $269,900
-
2017-07-14$274,900 Active
-
2017-01-15historical
-
2016-12-15status Active
-
2016-12-07historical Contingent - Inspection
-
2016-11-21status Active
-
2016-10-12historical Contingent - Inspection
-
2016-09-15price $174,900
-
2016-08-30$199,900 Active
-
1996-05-14soldstatus $48,500
ⓘ Source: listings_history table (triggers on properties + properties_extension) + one-shot
backfill from property_details.listing_events for pre-trigger history.
Tax reassessment forecast TN · Resets to sale price
- Current annual tax
- $2,519 · $210/mo
- Projected year-2 tax
- $2,519 · $210/mo
- Expected delta
- $0/yr ($0/mo · 0.0%)
ⓘ Screening estimate from a state-policy table — verify with the county assessor before closing.
Climate risk First Street
- Flood 9/10 Extreme FEMA zone X (unshaded) · 99% chance over 30 yrs
- Wildfire 1/10 Low
- Heat 6/10 Major 7 d/yr ≥105°F today · 20 d/yr by 30 yrs out
- Wind 4/10 Moderate 9% chance of damaging wind over 30 yrs
- Air quality 2/10 Low 1 unhealthy d/yr today · 2 by 30 yrs out
Nearby sold comps map
Loading sold comps map…
Walkable amenities ~0.75 mi
Loading nearby amenities…
Taxation est. · year 1
- Rental income
- $41,059
- − Mortgage interest
- −$18,205
- − Property taxes
- −$2,519
- − Insurance
- −$2,292
- − Repairs & maintenance
- −$3,285
- − Management
- −$3,285
- − Depreciation
- −$9,455
- Taxable income
- $2,020
- Est. tax owed @ 24.0%
- −$485
- After-tax cash flow
- $6,690/yr
For passive investors: Depreciation is non-cash, so a rental often shows a tax loss while cash-flowing — sheltering income. Rental losses are passive: they offset passive income freely, and up to $25,000/yr can offset ordinary (W-2) income if you actively participate and your MAGI is under $100k (phasing out to $0 by $150k); unused losses carry forward. On sale, claimed depreciation is recaptured at up to 25%, and gains may owe capital-gains tax (a 1031 exchange can defer both). Figures are a year-1 estimate at your 24.0% rate — not tax advice; consult a CPA.
Schools (NCES district)
- District
- Davidson County
- NCES district ID
- 4703180
- Math proficiency
- 12% ▼ -17.00%
- Reading proficiency
- 19% ▼ -7.00%
- Median HH income
- $48,667
- Composite
- 14.03/100
- National rank
- #9472
- State rank
- #126 of 139 in TN
Livability — Nashville-Davidson metropolitan government (balance)
No livability data for this city. (Only ~50 U.S. cities are tracked.)
Census & demographics
- Census place
- Nashville-Davidson metropolitan government (balance), TN
- County
- Davidson County · 680,067 people
- City population
- 677,595
- Metro
- Nashville-Davidson--Murfreesboro--Franklin, TN
- Population (ZIP)
- 28,545
- Household income
- $96,169
- Rent vs Own
- Severe rent burden
- 1317.0
Population outlook (Davidson County) Hauer SSP2
- Today (2025)
- 808,568 people
- By 2030
- 874,489 · +8.2%
- By 2040
- 1,009,046 · +24.8%
- By 2050
- 1,147,294 · +41.9%
- By 2075
- 1,475,439 · +82.5%
- By 2100
- 1,714,101 · +112.0%
Race, ethnicity, and origin ACS 2023
- Neighborhood character
- Diverse neighborhood (Simpson 0.56)
- Race & ethnicity
- White 60% Black 28% Two or more races 8% Hispanic / Latino 5% Asian 1%
- Hispanic origin (detail)
- Mexican 1%
- Common ancestry
- Lithuanian 3% Italian 2% Slovak 2%
- Foreign-born
- 5% · Canada, China
- Languages at home
- 94% English-only · Spanish 3% French/Haitian/Cajun 1% Korean 0%
Political lean MEDSL · Davidson
- 2024 margin
- Strong D (+27.4) · D 62.7% · R 35.3% · Other 2.0%
- 2008→2024 swing
- +6.5pp toward D · 2008: 21.0pp · 2024: 27.4pp
- All cycles
- 2024: D+27.4 2020: D+32.1 2016: D+26.0 2012: D+18.7 2008: D+21.0
Not yet ingested
- Civics
- —
Market trends
- HPI YoY
- ▼ -480.55%
- Current HPI
- 500.0973
- Rent YoY
- ▲ 1.53%
- Metro
- Nashville-Davidson--Murfreesboro--Franklin, TN
- State GDP YoY
- ▲ 2.78%
- F500 in state
- 22
Industry mix (Fortune 500 HQ in TN)
| Industry | F500 HQs | Revenue |
|---|---|---|
| Healthcare | 3 | $91B |
|
||
| Retail | 3 | $72B |
|
||
| Transportation / Logistics | 1 | $88B |
|
||
| Paper / Packaging | 1 | $19B |
|
||
| Insurance | 1 | $13B |
|
||
| Energy | 1 | $12B |
|
||
Price history
+570.1% since first listed21 events — show timeline
- 2026-05-04 Sold (Public Records) $325,000 Public Records
- 2026-04-15 Pending — REALTRACS as Distributed by MLS Grid
- 2026-03-17 Listed $325,000 REALTRACS as Distributed by MLS Grid
- 2026-01-20 Pending — REALTRACS as Distributed by MLS Grid
- 2026-01-20 Listing Removed — REALTRACS as Distributed by MLS Grid
- 2026-01-17 Listed $299,000 REALTRACS as Distributed by MLS Grid
- 2017-12-14 Listing Removed — REALTRACS as Distributed by MLS Grid
- 2017-10-17 Price Changed $247,500 REALTRACS as Distributed by MLS Grid
- 2017-10-02 Price Changed $248,500 REALTRACS as Distributed by MLS Grid
- 2017-08-31 Price Changed $249,900 REALTRACS as Distributed by MLS Grid
- 2017-08-09 Price Changed $264,900 REALTRACS as Distributed by MLS Grid
- 2017-08-02 Price Changed $269,900 REALTRACS as Distributed by MLS Grid
- 2017-07-14 Listed $274,900 REALTRACS as Distributed by MLS Grid
- 2017-01-15 Listing Removed — REALTRACS as Distributed by MLS Grid
- 2016-12-15 Relisted — REALTRACS as Distributed by MLS Grid
- 2016-12-07 Contingent — REALTRACS as Distributed by MLS Grid
- 2016-11-21 Relisted — REALTRACS as Distributed by MLS Grid
- 2016-10-12 Contingent — REALTRACS as Distributed by MLS Grid
- 2016-09-15 Price Changed $174,900 REALTRACS as Distributed by MLS Grid
- 2016-08-30 Listed $199,900 REALTRACS as Distributed by MLS Grid
- 1996-05-14 Sold (Public Records) $48,500 Public Records
Property tax history
+7.7%/yrLatest (2025): $2,519 · +20.2% YoY. Source: county tax records.
Cash-flow waterfall
monthlySold comps — $/sqft
last 12 mo · ≤1 miLoading sold comps…