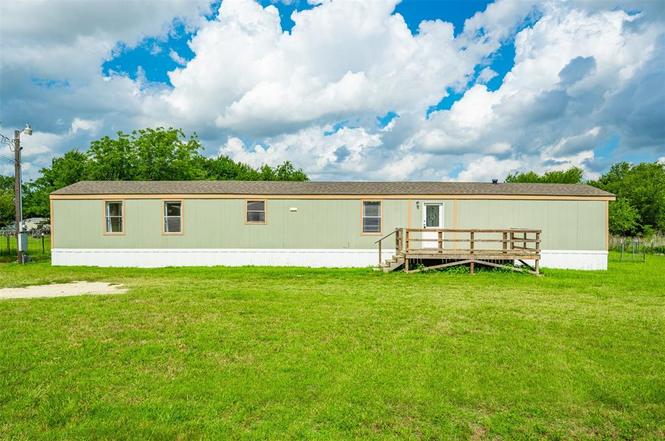
7009 Karen Ln
Burleson, TX 76058
$150,000B-
3 bd · 2.0 ba ·
1,216 sqft ·
Built 1998
· Manufactured
· Active
· 7 DOM
Cashflow @ list (25.0% down · 7.5%)
Estimated rent
$1,746/mo
Mortgage (P&I)
−$787
Tax + insurance
−$92
HOA
−$0
Vac / Maint / Mgmt
−$367
Net cashflow
$501/mo
Annual
$6,010/yr
Cap rate
10.30%
Cash-on-cash
14.31%
DSCR
1.64
1% rule
1.16%
Cash to close
$42,000
Investor read
- This is a 3-bed/2.0-bath manufactured listed at $150k.
- At list price, monthly cash flow is $501 ($6k/yr) — positive.
- The deal already cash-flows at list — no discount required.
- Meets the 1% rule at list price ($2k rent vs $150k).
- Only 7 days on market — expect competitive offers; lowballing is unlikely to land.
- Local home prices are declining (-3.0%/yr); year-one equity from $1k of loan paydown is wiped out by about $4k of value loss. Plan a longer hold.
- Location reads 79/100 on livability (#53 in TX, #2,133 nationally) — a middle-class / working-renter tenant base. Strengths: employment A+, cost of living A+, housing A+; Watch: amenities F, commute F.
- Joshua ISD (rural): math 52% / reading 50% proficiency, ranked #139 of 826 in TX (top 17%) — acceptable for families but not a draw, mixed tenant base, ~2y average lease.
- Zoned schools: Caddo Grove El (math 36% / reading 28%, grade F, #2,268 of 4,322 statewide, top 55%, 595 students, 71% FRL) — zoned schools average 71% FRL vs 45% district-wide (27 pts higher); higher-poverty schools than district average — tighter screening recommended.
- Zoned-school proficiency averages 32% at this address vs 51% district-wide (-19 pts) — the specific schools serving this property underperform the Joshua ISD average; the district grade overstates school quality for this exact location.
- Market conditions: 420 active listings in the ZIP; 2 comparable units currently listed for rent nearby; 2,152 units permitted in Johnson County in 2024 (76 in 5+ unit buildings).
- Johnson County population projected at +24% by 2050 — long-run rental-demand tailwind backs the buy-and-hold thesis.
- At projected returns (-3.0% appreciation + 3.0% rent growth), your $42k cash investment doubles in ~9 years — after that, you're playing with house money.
- Climate carrying-cost: major wind risk, 27% chance of damaging wind over 30y; moderate wildfire risk; extreme-heat days projected 7→24/yr by 2055 (HVAC capex compounding) — expect insurance premiums to compound above CPI over the hold.
- Cap rate 10.3% vs local median 3.5% in Burleson — top-decile yield for the area; either an underpriced asset or a hidden risk that comps aren't pricing in. Stress-test before assuming the spread holds.
Questions for listing agent
- Is there a deadline driving the sale (1031 exchange, divorce, estate, relocation)? That informs how much negotiation room exists.
- What's the average days-on-market for RENTAL listings here right now (not sales)? A rising rental-DOM trend means longer vacancies and softer asking-rent achievability than the comps imply.
- What's the recent tenant-quality profile in this submarket — average credit score on applications, eviction rate, late-payment / NSF rate, and stable-employment percentage? A property-management company in the area should have these aggregated.
- How much new for-sale + rental construction is in the pipeline within 1–3 miles? Heavy new supply typically softens prices + rents 12–24 months out; constrained supply supports both.
CashFlowRE · CFR-V5C9171A7A7CSQ
· Data 2 days ago
cashflowre.app · 2026-05-29