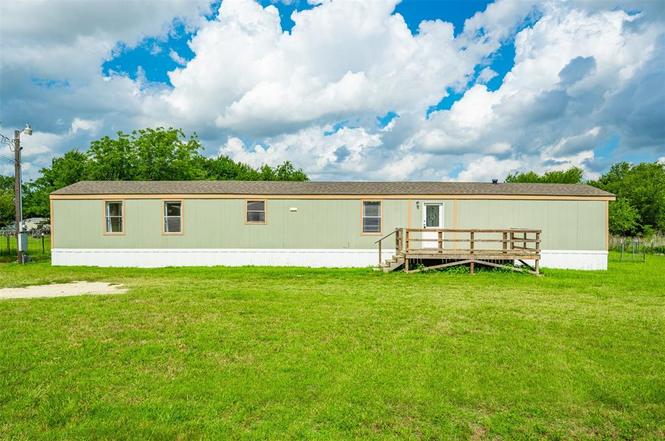
7009 Karen Ln · Burleson, TX
Flood risk 1/10 · Minimal
- FEMA flood zone
- X (unshaded)
- Chance of flooding over 30 yrs
- 0.0%
- Est. flood insurance / yr
- $507 – $1,088
Fire risk 5/10 · Moderate
- Est. fire insurance / yr
- $1,222 – $2,270
Heat risk 7/10 · Major
- Hot days now (above 109°F)
- 7 days/yr
- Hot days in 30 yrs
- 24 days/yr
Wind risk 6/10 · Moderate
- Chance of severe wind over 30 yrs
- 27.0%
Air-quality risk 2/10 · Minimal
- Unhealthy air days now
- 1 days/yr
- Unhealthy air days in 30 yrs
- 2 days/yr
Risk factors via First Street. Map © Google.
Why this score? — see what drove the B- grade
The composite is a weighted blend of 9 inputs, each scored 0–100. Each bar is that input's sub-score; the figure is the points it added to the 100-point composite (weight × sub-score).
- Cash flow +28.7/30.0
- DSCR +10.0/10.0
- ARV discount +7.5/15.0
- 1% rule +6.6/10.0
- Schools +4.5/10.0
- Livability +4.0/5.0
- Rent growth +2.5/5.0
- Condition / age +2.5/5.0
- Appreciation +0.0/10.0
$150,000
🖨 Deal sheet 📄 Offer letter ✓ Due diligence
Listing remarks
Investor Special or first time homebuyers! This property has been continually rented, and it is now available for purchase. You will find a very well-maintained property which is a proven income producing property. The square footage is small but the three bedroom, 2 bathroom home is efficient, well laid-out and perfect for a small family. The property is newly painted and ready for a new owner. The grassed backyard is ideal for pets or could be used as a play area. The property provides excellent access to the Chisholm Trail Tollway and makes your commute to the Metroplex a breeze. This property has been very well taken care of and will provide an excellent opportunity to the buyer. It's m
Key facts
- Move-in ready
- New exterior paint
- Fully skirted
Tags
Property features AI
Finance
- Other: Multi-parcel property
- Financial info: Accepts cash, 1031 exchange, and VA loan; Treat as clear loan type; No second mortgage
- HOA & community: No association
Exterior
- Parking: Off-street parking
- Utilities: Aerobic septic; Co-op electric; Co-op water; Outside city limits
- Home design: Manufactured home (residential); One story; Not attached; Subdivision: Walden Estates
- Construction: Built in 1998
- Exterior features: Interior lot; Large backyard with grass; All-weather road
Interior
- Kitchen: Built-in cabinets; Kitchen island; Eat-in kitchen
- Bedrooms: 3 bedrooms (all on main level); Primary bedroom with ensuite bath, garden tub, separate shower, dual sinks, and walk-in closet; Second bedroom with walk-in closet; Third bedroom on main level
- Bathrooms: 2 full bathrooms
- Heating & cooling: Central air conditioning; Ceiling fans; Electric heating
- Interior features: Eat-in kitchen; Kitchen island; Walk-in closets; One living area; One dining area; 7 total rooms; One-level layout
- Laundry & utility: Main-level laundry with built-in cabinets
Neighborhood map
What this means for you Summary
Snapshot
- This is a 3-bed/2.0-bath manufactured listed at $150k.
Deal economics
- At list price, monthly cash flow is $501 ($6k/yr) — positive.
- The deal already cash-flows at list — no discount required.
- Meets the 1% rule at list price ($2k rent vs $150k).
- Cap rate 10.3% vs local median 3.5% in Burleson — top-decile yield for the area; either an underpriced asset or a hidden risk that comps aren't pricing in. Stress-test before assuming the spread holds.
Location & tenants
- Location reads 79/100 on livability (#53 in TX, #2,133 nationally) — a middle-class / working-renter tenant base. Strengths: employment A+, cost of living A+, housing A+; Watch: amenities F, commute F.
- Joshua ISD (rural): math 52% / reading 50% proficiency, ranked #139 of 826 in TX (top 17%) — acceptable for families but not a draw, mixed tenant base, ~2y average lease.
- Zoned schools: Caddo Grove El (math 36% / reading 28%, grade F, #2,268 of 4,322 statewide, top 55%, 595 students, 71% FRL) — zoned schools average 71% FRL vs 45% district-wide (27 pts higher); higher-poverty schools than district average — tighter screening recommended.
- Zoned-school proficiency averages 32% at this address vs 51% district-wide (-19 pts) — the specific schools serving this property underperform the Joshua ISD average; the district grade overstates school quality for this exact location.
- Market conditions: 420 active listings in the ZIP; 2 comparable units currently listed for rent nearby; 2,152 units permitted in Johnson County in 2024 (76 in 5+ unit buildings).
Forward outlook
- Local home prices are declining (-3.0%/yr); year-one equity from $1k of loan paydown is wiped out by about $4k of value loss. Plan a longer hold.
- Johnson County population projected at +24% by 2050 — long-run rental-demand tailwind backs the buy-and-hold thesis.
- At projected returns (-3.0% appreciation + 3.0% rent growth), your $42k cash investment doubles in ~9 years — after that, you're playing with house money.
Negotiation context
- Only 7 days on market — expect competitive offers; lowballing is unlikely to land.
Risks & watch-outs
- Climate carrying-cost: major wind risk, 27% chance of damaging wind over 30y; moderate wildfire risk; extreme-heat days projected 7→24/yr by 2055 (HVAC capex compounding) — expect insurance premiums to compound above CPI over the hold.
Questions for the listing agent
- Is there a deadline driving the sale (1031 exchange, divorce, estate, relocation)? That informs how much negotiation room exists.
- What's the average days-on-market for RENTAL listings here right now (not sales)? A rising rental-DOM trend means longer vacancies and softer asking-rent achievability than the comps imply.
- What's the recent tenant-quality profile in this submarket — average credit score on applications, eviction rate, late-payment / NSF rate, and stable-employment percentage? A property-management company in the area should have these aggregated.
- How much new for-sale + rental construction is in the pipeline within 1–3 miles? Heavy new supply typically softens prices + rents 12–24 months out; constrained supply supports both.
Investment metrics
- 1% rule
- 1.16% ✓
- Cap rate
- 10.30%
- Cash-on-cash
- 14.31%
- DSCR
- 1.64
- GRM
- 7.2
CMA / ARV
- ARV (on-the-fly)
- $85,120
- Comps found
- 1
Show comp detail 1 sale within ~0.75 mi
| Address | Dist | Beds/Ba | Sqft | Sold | Price | $/sf | Match |
|---|---|---|---|---|---|---|---|
| 7112 Walden Dr | 0.17mi | 3/2.0 | 1,248 (+3%) | 21mo | $87,500 | $70 | 70 |
Match score weights: distance 35% · size 25% · config 20% · recency 20%. Top-matched comps best support the ARV.
Projected returns pro-forma
-3.0% appreciation · 3.0% rent growth · sell at horizon
- IRR
- 4.6%
- Equity multiple
- 1.18×
- Total profit
- $7,521
- Equity at exit
- $22,365
- IRR
- 14.1%
- Equity multiple
- 2.13×
- Total profit
- $47,337
- Equity at exit
- $12,969
Cash invested: $42,000 (down + closing). Projections, not guarantees.
Landlord ↔ Tenant lean methodology
- Overall (STATE)
- 87 Strongly Landlord-Friendly
- State Texas
- 87 Strongly Landlord-Friendly · R+5
- County
- — inherits STATE
- City
- — inherits STATE
ZIP-level market 76058
- Home prices YoY
- -24.5%
- Active inventory
- 420
- Price-to-rent
- 7.2×
Monthly cashflow live
- Estimated rent
- $1,746 medium interval (Pro) →
- Mortgage (P&I)
- −$787
- Tax from tax record
- −$30 /mo · $357/yr
- Insurance
- −$62
- HOA
- −$0
- Vacancy / Maint / Mgmt
- −$367
- Net cashflow
- $501
Break-even live
UW: 25.0% down · 7.5% · 30yr · 1.5% tax · 5.0% vac · 8.0% maint · 8.0% mgmt
Financing live
Cash to close
- Down payment
- $37,500
- Closing costs
- $4,500
- Reserves months
- —
- Total cash needed
- —
Loan-product check · same deal, 3 products live
Conventional
25% down · 7.5% · 30yr
- Down + closing
- —
- Monthly P&I
- —
- Monthly cashflow
- —
- DSCR
- —
- Eligible?
- —
Personal DTI + credit; lowest rate.
DSCR
20% down · 8.5% · 30yr
- Down + closing
- —
- Monthly P&I
- —
- Monthly cashflow
- —
- DSCR
- —
- Eligible?
- —
No personal income docs; deal must DSCR.
Hard money
10% down · 12.0% · 12mo
- Down + closing
- —
- Monthly P&I
- —
- Monthly cashflow
- —
- DSCR
- —
- Eligible?
- —
Short-term bridge; refi at stabilization.
Rent comps 2 comps
| Address | Beds | Baths | Sqft | Rent | $/sqft | DOM | Units | Dist |
|---|---|---|---|---|---|---|---|---|
| 7700 Stanley Ct Unit 7700 Joshua, TX | 4.0 | 2.0 | 1352 | $1,695 | $1.25 | 24d | 1 | 1.01mi |
| 7731 Stanley Ct Joshua, TX | 4.0 | 2.0 | 1276 | $1,800 | $1.41 | 22d | 1 | 1.12mi |
Listing history 6 events
-
2026-06-18days on market $150,000 Active 7 DOM
-
2026-06-17days on market $150,000 Active 6 DOM
-
2026-06-16days on market $150,000 Active 5 DOM
-
2026-06-15days on market $150,000 Active 4 DOM
-
2026-06-13remarks 699-char remark
-
2026-06-13$150,000 Active 2 DOM
ⓘ Source: listings_history table (triggers on properties + properties_extension) + one-shot
backfill from property_details.listing_events for pre-trigger history.
Tax reassessment forecast TX · Resets to sale price
- Current annual tax
- $357 · $30/mo
- Projected year-2 tax
- $2,745 · $229/mo
- Expected delta
- +$2,388/yr (+$199/mo · 668.0%)
ⓘ Screening estimate from a state-policy table — verify with the county assessor before closing.
Climate risk First Street
- Flood 1/10 Low FEMA zone X (unshaded) · 0% chance over 30 yrs
- Wildfire 5/10 Major
- Heat 7/10 Severe 7 d/yr ≥109°F today · 24 d/yr by 30 yrs out
- Wind 6/10 Major 27% chance of damaging wind over 30 yrs
- Air quality 2/10 Low 1 unhealthy d/yr today · 2 by 30 yrs out
Nearby sold comps map
Loading sold comps map…
Walkable amenities ~0.75 mi
Loading nearby amenities…
Taxation est. · year 1
- Rental income
- $20,958
- − Mortgage interest
- −$8,402
- − Property taxes
- −$357
- − Insurance
- −$750
- − Repairs & maintenance
- −$1,677
- − Management
- −$1,677
- − Depreciation
- −$4,364
- Taxable income
- $3,731
- Est. tax owed @ 24.0%
- −$896
- After-tax cash flow
- $5,114/yr
For passive investors: Depreciation is non-cash, so a rental often shows a tax loss while cash-flowing — sheltering income. Rental losses are passive: they offset passive income freely, and up to $25,000/yr can offset ordinary (W-2) income if you actively participate and your MAGI is under $100k (phasing out to $0 by $150k); unused losses carry forward. On sale, claimed depreciation is recaptured at up to 25%, and gains may owe capital-gains tax (a 1031 exchange can defer both). Figures are a year-1 estimate at your 24.0% rate — not tax advice; consult a CPA.
Schools (NCES district)
- District
- Joshua ISD
- NCES district ID
- 4824930
- Math proficiency
- 52% ▼ -7.00%
- Reading proficiency
- 50% ▼ -1.00%
- Median HH income
- $60,696
- Composite
- 44.65/100
- National rank
- #2769
- State rank
- #139 of 826 in TX
Livability — Burleson
- Score
- 79/100
- State rank
- #53
- US rank
- #2133
Category grades
Schools grade is shown separately in the Schools card above.
Census & demographics
- City population
- 81,549
- Population (ZIP)
- 21,531
Population outlook (Johnson County) Hauer SSP2
- Today (2025)
- 179,678 people
- By 2030
- 189,208 · +5.3%
- By 2040
- 207,261 · +15.4%
- By 2050
- 223,064 · +24.1%
- By 2075
- 259,979 · +44.7%
- By 2100
- 275,395 · +53.3%
Race, ethnicity, and origin ACS 2023
- Neighborhood character
- Predominantly White (67%)
- Race & ethnicity
- White 67% Hispanic / Latino 28% Two or more races 11% Black 2%
- Hispanic origin (detail)
- Mexican 26%
- Common ancestry
- Italian 2% Slovak 2% Portuguese 1%
- Foreign-born
- 7% · Canada
- Languages at home
- 80% English-only · Spanish 18% German/W. Germanic 1%
Political lean MEDSL · Johnson
- 2024 margin
- Solid R (+51.4) · D 23.9% · R 75.3%
- 2008→2024 swing
- -3.9pp toward R · 2008: -47.5pp · 2024: -51.4pp
- All cycles
- 2024: R+51.4 2020: R+53.0 2016: R+58.3 2012: R+55.6 2008: R+47.5
Not yet ingested
- Civics
- —
Market trends
- HPI YoY
- ▼ -86.22%
- Current HPI
- 265.6513
- Rent YoY
- —
- Metro
- —
- State GDP YoY
- ▲ 3.95%
- F500 in state
- 110
Industry mix (Fortune 500 HQ in TX)
| Industry | F500 HQs | Revenue |
|---|---|---|
| Energy | 16 | $1,198B |
|
||
| Technology | 5 | $198B |
|
||
| Engineering / Construction | 4 | $72B |
|
||
| Energy Services | 3 | $60B |
|
||
| Utilities | 3 | $41B |
|
||
| Healthcare | 2 | $330B |
|
||
Price history
1 event — show timeline
- 2026-06-09 Listed $150,000 NTREIS
Property tax history
-1.1%/yrLatest (2025): $357 · +0.5% YoY. Source: county tax records.
Cash-flow waterfall
monthlySold comps — $/sqft
last 12 mo · ≤1 miLoading sold comps…