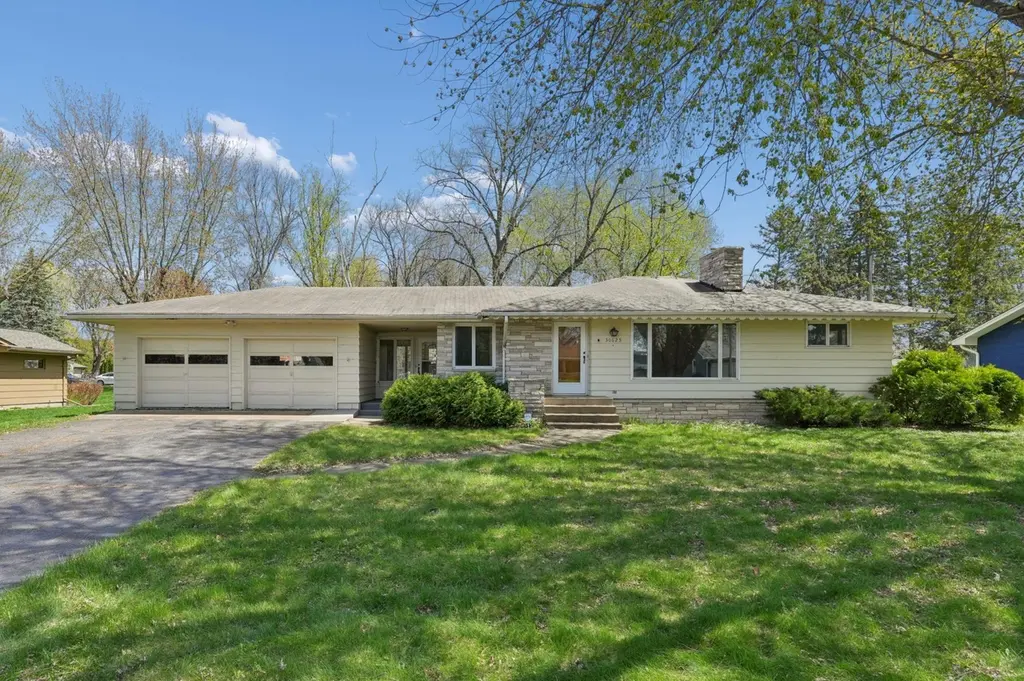
30625 Broadway St
Lindstrom, MN 55045
$268,900D
3 bd · 2.0 ba ·
1,885 sqft ·
Built 1966
· SingleFamily
· Pending
· 13 DOM
Cashflow @ list (25.0% down · 7.5%)
Estimated rent
$2,294/mo
Mortgage (P&I)
−$1,410
Tax + insurance
−$393
HOA
−$0
Vac / Maint / Mgmt
−$482
Net cashflow
$9/mo
Annual
$112/yr
Cap rate
6.33%
Cash-on-cash
0.15%
DSCR
1.01
1% rule
0.85%
Cash to close
$75,292
Investor read
- This is a 3-bed/2.0-bath single-family listed at $269k.
- At list price, monthly cash flow is $9 ($112/yr) — positive.
- The deal already cash-flows at list — no discount required.
- To meet the 1% rule (rent ≥ 1% of price), the offer needs to be $229k (14.7% below list).
- Only 13 days on market — expect competitive offers; lowballing is unlikely to land.
- Recommended offer: $229k (14.7% below list) — sets the bar for 1% rule.
- Local home prices are declining (-3.0%/yr); year-one equity from $2k of loan paydown is wiped out by about $8k of value loss. Plan a longer hold.
- Location reads 69/100 on livability (#350 in MN) — a middle-class / working-renter tenant base. Strengths: employment A+, housing A+, crime A; Watch: amenities F, commute F, health & safety F.
- Chisago Lakes School District (town): math 45% / reading 56% proficiency, ranked #91 of 301 in MN (top 30%) — acceptable for families but not a draw, mixed tenant base, ~2y average lease; only 16% free/reduced lunch — higher-income household profile.
- Zoned schools: Lakeside El. (math 57% / reading 58%, grade C+, #261 of 857 statewide, top 31%, 754 students, 24% FRL); Chisago Lakes Middle (math 37% / reading 51%, grade D, #126 of 258 statewide, top 49%, 796 students, 30% FRL); Chisago Lakes Senior High (math 47% / reading 68%, grade C, #59 of 471 statewide, top 13%, 1,053 students, 21% FRL).
- Market conditions: 80 active listings in the ZIP; 2 comparable units currently listed for rent nearby; 362 units permitted in Chisago County in 2024 (121 in 5+ unit buildings).
- Chisago County population projected at -11% by 2050 — secular population decline; favor cash flow + early exit over multi-decade hold.
- 7 sale attempts since 18y ago with the ask held roughly flat each time — persistent listings suggest the price (not the market) is what's stuck; bring a comps-based counter.
- Cap rate 6.3% vs local median 3.4% in Lindstrom — top-decile yield for the area; either an underpriced asset or a hidden risk that comps aren't pricing in. Stress-test before assuming the spread holds.
Questions for listing agent
- Built in 1966 — when were the roof, HVAC, electrical panel, plumbing, and water heater last replaced?
- Is there a deadline driving the sale (1031 exchange, divorce, estate, relocation)? That informs how much negotiation room exists.
- Schools are B-rated — typically a magnet for longer-tenancy family renters. What's the average tenant stay here, and is there a school-zone premium baked into asking?
- The area grade is low — what's the realistic commute time and amenity access for the typical tenant pool here? Any planned neighborhood developments (good or bad) we should know about?
- What's the average days-on-market for RENTAL listings here right now (not sales)? A rising rental-DOM trend means longer vacancies and softer asking-rent achievability than the comps imply.
- What's the recent tenant-quality profile in this submarket — average credit score on applications, eviction rate, late-payment / NSF rate, and stable-employment percentage? A property-management company in the area should have these aggregated.
- How much new for-sale + rental construction is in the pipeline within 1–3 miles? Heavy new supply typically softens prices + rents 12–24 months out; constrained supply supports both.
CashFlowRE · CFR-VA4YMQ4WZRH8MX
· Data 3 weeks ago
cashflowre.app · 2026-05-29