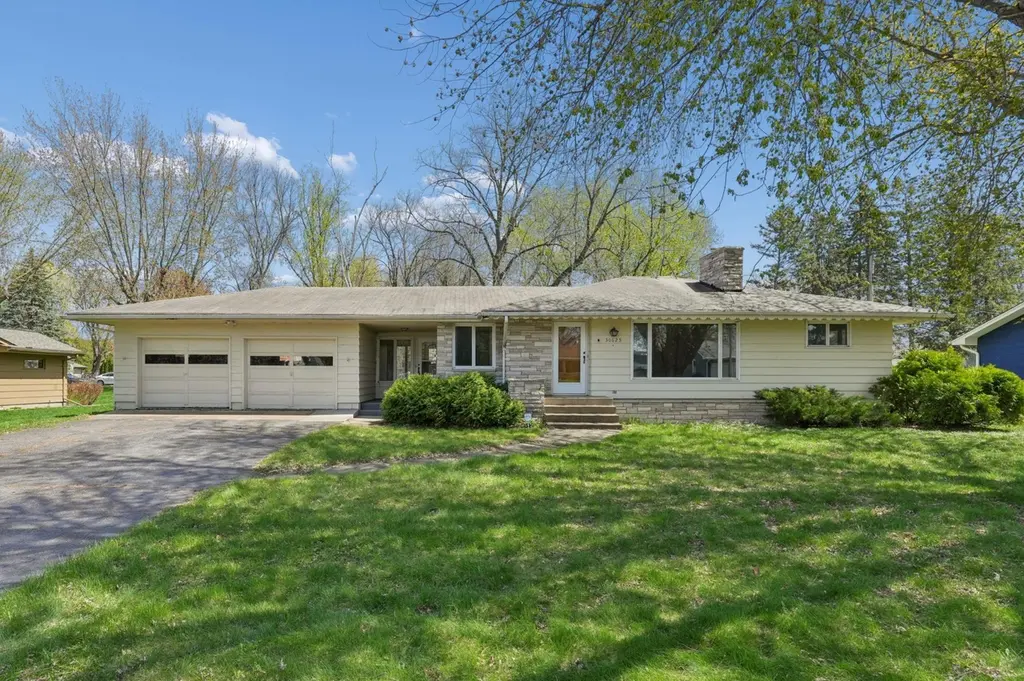
30625 Broadway St · Lindstrom, MN
Flood risk 1/10 · Minimal
- FEMA flood zone
- X (unshaded)
- Chance of flooding over 30 yrs
- 0.0%
- Est. flood insurance / yr
- $507 – $1,088
Fire risk 1/10 · Minimal
- Est. fire insurance / yr
- $888 – $1,650
Heat risk 2/10 · Minimal
- Hot days now (above 99°F)
- 7 days/yr
- Hot days in 30 yrs
- 14 days/yr
Wind risk 1/10 · Minimal
- Chance of severe wind over 30 yrs
- —
Air-quality risk 2/10 · Minimal
- Unhealthy air days now
- 1 days/yr
- Unhealthy air days in 30 yrs
- 3 days/yr
Risk factors via First Street. Map © Google.
Why this score? — see what drove the D grade
The composite is a weighted blend of 9 inputs, each scored 0–100. Each bar is that input's sub-score; the figure is the points it added to the 100-point composite (weight × sub-score).
- Cash flow +13.5/30.0
- ARV discount +7.5/15.0
- Schools +4.5/10.0
- DSCR +4.1/10.0
- 1% rule +3.5/10.0
- Livability +3.5/5.0
- Rent growth +2.5/5.0
- Condition / age +2.5/5.0
- Appreciation +0.0/10.0
$268,900
🖨 Deal sheet (PDF) 📄 Offer letter ✓ Due diligence
Listing remarks MLS
Great area, nice neighborhood. Lovely, comfortable, clean, move-in ready home in excellent condition! Nice shaded backyard, Spacious living & family rooms, cozy den, new kitchen & baths. Newer appliances, water heater, water softener. Walk to downtown.
Key facts
- Spacious lot
- 0.32 acre lot
- 2 garage spots
Tags
Property features AI
Finance
- Financial info: Property taxes listed (most recent year shown separately)
- HOA & community: $39 other annual assessment
Exterior
- Parking: Attached garage with asphalt surface; 2-car garage (approx. 23 x 24)
- Utilities: City water connected; City sewer connected; Natural gas fuel; Electric service with circuit breakers
- Home design: Residential property; One level (with lower level/basement); Block foundation
- Construction: Stone and wood exterior; Roof older than 8 years
- Exterior features: Covered porch/patio; Additional porch type (other); No fencing; Lot dimensions approximately 103 x 145 (0.318 acres); City street frontage
Interior
- Kitchen: Dishwasher; Range; Refrigerator
- Bedrooms: 3 bedrooms total; Main level bedroom (12 x 10); Main level bedroom (10 x 10); Lower-level bedroom (13 x 11)
- Bathrooms: 1 full bathroom; 1 three-quarter bathroom
- Heating & cooling: Forced air heating; Central air conditioning
- Interior features: Full basement; Two wood-burning fireplaces (living room and family room); Separate/formal dining room; Covered and other-type porch/patio; Stone and wood exterior accents; Water softener (owned)
- Laundry & utility: Washer hookup; Dryer hookup (gas); Laundry room on lower level
Neighborhood map
What this means for you Summary
Snapshot
- This is a 3-bed/2.0-bath single-family listed at $269k.
Deal economics
- At list price, monthly cash flow is $9 ($112/yr) — positive.
- The deal already cash-flows at list — no discount required.
- To meet the 1% rule (rent ≥ 1% of price), the offer needs to be $229k (14.7% below list).
- Recommended offer: $229k (14.7% below list) — sets the bar for 1% rule.
- Cap rate 6.3% vs local median 3.4% in Lindstrom — top-decile yield for the area; either an underpriced asset or a hidden risk that comps aren't pricing in. Stress-test before assuming the spread holds.
Location & tenants
- Location reads 69/100 on livability (#350 in MN) — a middle-class / working-renter tenant base. Strengths: employment A+, housing A+, crime A; Watch: amenities F, commute F, health & safety F.
- Chisago Lakes School District (town): math 45% / reading 56% proficiency, ranked #91 of 301 in MN (top 30%) — acceptable for families but not a draw, mixed tenant base, ~2y average lease; only 16% free/reduced lunch — higher-income household profile.
- Zoned schools: Lakeside El. (math 57% / reading 58%, grade C+, #261 of 857 statewide, top 31%, 754 students, 24% FRL); Chisago Lakes Middle (math 37% / reading 51%, grade D, #126 of 258 statewide, top 49%, 796 students, 30% FRL); Chisago Lakes Senior High (math 47% / reading 68%, grade C, #59 of 471 statewide, top 13%, 1,053 students, 21% FRL).
- Market conditions: 80 active listings in the ZIP; 2 comparable units currently listed for rent nearby; 362 units permitted in Chisago County in 2024 (121 in 5+ unit buildings).
Forward outlook
- Local home prices are declining (-3.0%/yr); year-one equity from $2k of loan paydown is wiped out by about $8k of value loss. Plan a longer hold.
- Chisago County population projected at -11% by 2050 — secular population decline; favor cash flow + early exit over multi-decade hold.
Negotiation context
- Only 13 days on market — expect competitive offers; lowballing is unlikely to land.
- 7 sale attempts since 18y ago with the ask held roughly flat each time — persistent listings suggest the price (not the market) is what's stuck; bring a comps-based counter.
Questions for the listing agent
- Built in 1966 — when were the roof, HVAC, electrical panel, plumbing, and water heater last replaced?
- Is there a deadline driving the sale (1031 exchange, divorce, estate, relocation)? That informs how much negotiation room exists.
- Schools are B-rated — typically a magnet for longer-tenancy family renters. What's the average tenant stay here, and is there a school-zone premium baked into asking?
- The area grade is low — what's the realistic commute time and amenity access for the typical tenant pool here? Any planned neighborhood developments (good or bad) we should know about?
- What's the average days-on-market for RENTAL listings here right now (not sales)? A rising rental-DOM trend means longer vacancies and softer asking-rent achievability than the comps imply.
- What's the recent tenant-quality profile in this submarket — average credit score on applications, eviction rate, late-payment / NSF rate, and stable-employment percentage? A property-management company in the area should have these aggregated.
- How much new for-sale + rental construction is in the pipeline within 1–3 miles? Heavy new supply typically softens prices + rents 12–24 months out; constrained supply supports both.
Investment metrics
- 1% rule
- 0.85% ✗
- Cap rate
- 6.33%
- Cash-on-cash
- 0.15%
- DSCR
- 1.01
- GRM
- 9.8
CMA / ARV
No comps found within radius.
Projected returns pro-forma
-3.0% appreciation · 3.0% rent growth · sell at horizon
- IRR
- -16.1%
- Equity multiple
- 0.43×
- Total profit
- $-42,979
- Equity at exit
- $40,094
- IRR
- -7.7%
- Equity multiple
- 0.51×
- Total profit
- $-36,658
- Equity at exit
- $23,250
Cash invested: $75,292 (down + closing). Projections, not guarantees.
Landlord ↔ Tenant lean methodology
- Overall (STATE)
- 46 Balanced
- State Minnesota
- 46 Balanced · D+2
- County
- — inherits STATE
- City
- — inherits STATE
ZIP-level market 55045
- Home prices YoY
- -20.4%
- Active inventory
- 80
- Price-to-rent
- 9.8×
Monthly cashflow live
- Estimated rent
- $2,294 medium interval (Pro) →
- Mortgage (P&I)
- −$1,410
- Tax from tax record
- −$281 /mo · $3,372/yr
- Insurance
- −$112
- HOA
- −$0
- Vacancy / Maint / Mgmt
- −$482
- Net cashflow
- $9
Break-even live
Sensitivity live
| Price | -10% $162 | -5% $85 | +0% $9 | +5% $-67 | +10% $-143 |
|---|---|---|---|---|---|
| Rent | -10% $-172 | -5% $-81 | +0% $9 | +5% $100 | +10% $191 |
| Rate | -1.0pp $145 | -0.5pp $78 | base $9 | +0.5pp $-60 | +1.0pp $-131 |
UW: 25.0% down · 7.5% · 30yr · 1.5% tax · 5.0% vac · 8.0% maint · 8.0% mgmt
Financing live
Cash to close
- Down payment
- $67,225
- Closing costs
- $8,067
- Reserves months
- —
- Total cash needed
- —
Loan-product check · same deal, 3 products live
Conventional
25% down · 7.5% · 30yr
- Down + closing
- —
- Monthly P&I
- —
- Monthly cashflow
- —
- DSCR
- —
- Eligible?
- —
Personal DTI + credit; lowest rate.
DSCR
20% down · 8.5% · 30yr
- Down + closing
- —
- Monthly P&I
- —
- Monthly cashflow
- —
- DSCR
- —
- Eligible?
- —
No personal income docs; deal must DSCR.
Hard money
10% down · 12.0% · 12mo
- Down + closing
- —
- Monthly P&I
- —
- Monthly cashflow
- —
- DSCR
- —
- Eligible?
- —
Short-term bridge; refi at stabilization.
Rent comps 2 comps
| Address | Beds | Baths | Sqft | Rent | $/sqft | DOM | Units | Dist |
|---|---|---|---|---|---|---|---|---|
| 30630 Broadway St Lindstrom, MN | 3.0 | 1.5 | 2049 | $2,265 | $1.11 | 45d | 1 | 0.06mi |
| 29850 Glader Blvd Lindstrom, MN | 3.0 | 2.0 | 1872 | $2,650 | $1.42 | 45d | 1 | 1.31mi |
Listing history 20 events
-
2026-05-15$268,900 Active 692-char remark
-
2026-05-01$268,000 Active
-
2026-04-28historical
-
2014-07-18soldstatus $152,500
-
2014-07-17soldstatus $152,500 Sold
Show marketing remark (261 chars)
Great area, nice neighborhood. Lovely, comfortable, clean, move-in ready home in excellent condition! Nice shaded backyard, Spacious living & family rooms, cozy den, new kitchen & baths. Newer appliances, water heater, water softener. Walk to downtown.
-
2014-07-17soldstatus $152,500
Show marketing remark (261 chars)
Great area, nice neighborhood. Lovely, comfortable, clean, move-in ready home in excellent condition! Nice shaded backyard, Spacious living & family rooms, cozy den, new kitchen & baths. Newer appliances, water heater, water softener. Walk to downtown.
-
2014-05-15historical Contingent - Inspection
Show marketing remark (261 chars)
Great area, nice neighborhood. Lovely, comfortable, clean, move-in ready home in excellent condition! Nice shaded backyard, Spacious living & family rooms, cozy den, new kitchen & baths. Newer appliances, water heater, water softener. Walk to downtown.
-
2014-05-15status Pending
Show marketing remark (261 chars)
Great area, nice neighborhood. Lovely, comfortable, clean, move-in ready home in excellent condition! Nice shaded backyard, Spacious living & family rooms, cozy den, new kitchen & baths. Newer appliances, water heater, water softener. Walk to downtown.
-
2014-05-15price $158,900
Show marketing remark (261 chars)
Great area, nice neighborhood. Lovely, comfortable, clean, move-in ready home in excellent condition! Nice shaded backyard, Spacious living & family rooms, cozy den, new kitchen & baths. Newer appliances, water heater, water softener. Walk to downtown.
-
2014-03-19$169,900 Active
Show marketing remark (261 chars)
Great area, nice neighborhood. Lovely, comfortable, clean, move-in ready home in excellent condition! Nice shaded backyard, Spacious living & family rooms, cozy den, new kitchen & baths. Newer appliances, water heater, water softener. Walk to downtown.
-
2014-03-18$158,900
-
2014-03-18$158,900
-
2009-07-06soldstatus $72,950
-
2009-07-06soldstatus $72,950
-
2009-06-30soldstatus $145,900
-
2009-05-28historical
-
2009-03-02$149,900
-
2009-03-01historical
-
2008-08-28$159,900
ⓘ Source: listings_history table (triggers on properties + properties_extension) + one-shot
backfill from property_details.listing_events for pre-trigger history.
Tax reassessment forecast MN · Partial reset (capped growth)
- Current annual tax
- $3,372 · $281/mo
- Projected year-2 tax
- $3,372 · $281/mo
- Expected delta
- $0/yr ($0/mo · 0.0%)
ⓘ Screening estimate from a state-policy table — verify with the county assessor before closing.
Climate risk First Street
- Flood 1/10 Low FEMA zone X (unshaded) · 0% chance over 30 yrs
- Wildfire 1/10 Low
- Heat 2/10 Low 7 d/yr ≥99°F today · 14 d/yr by 30 yrs out
- Wind 1/10 Low
- Air quality 2/10 Low 1 unhealthy d/yr today · 3 by 30 yrs out
Nearby sold comps map
Loading sold comps map…
Walkable amenities ~0.75 mi
Loading nearby amenities…
Taxation est. · year 1
- Rental income
- $27,532
- − Mortgage interest
- −$15,063
- − Property taxes
- −$3,372
- − Insurance
- −$1,344
- − Repairs & maintenance
- −$2,203
- − Management
- −$2,203
- − Depreciation
- −$7,823
- Taxable loss
- −$4,475
- Est. tax savings @ 24.0%
- +$1,074
- After-tax cash flow
- $1,186/yr
For passive investors: Depreciation is non-cash, so a rental often shows a tax loss while cash-flowing — sheltering income. Rental losses are passive: they offset passive income freely, and up to $25,000/yr can offset ordinary (W-2) income if you actively participate and your MAGI is under $100k (phasing out to $0 by $150k); unused losses carry forward. On sale, claimed depreciation is recaptured at up to 25%, and gains may owe capital-gains tax (a 1031 exchange can defer both). Figures are a year-1 estimate at your 24.0% rate — not tax advice; consult a CPA.
Schools (NCES district)
- District
- Chisago Lakes School District
- NCES district ID
- 2700017
- Math proficiency
- 45% ▼ -18.00%
- Reading proficiency
- 56% ▼ -10.00%
- Median HH income
- $71,167
- Composite
- 45.18/100
- National rank
- #2674
- State rank
- #91 of 301 in MN
Livability — Lindstrom
- Score
- 69/100
- State rank
- #350
- US rank
- #8161
Category grades
Schools grade is shown separately in the Schools card above.
Census & demographics
- Census place
- Lindstrom, MN
- Population (ZIP)
- 7,854
Population outlook (Chisago County) Hauer SSP2
- Today (2025)
- 55,187 people
- By 2030
- 55,036 · -0.3%
- By 2040
- 53,293 · -3.4%
- By 2050
- 49,157 · -10.9%
- By 2075
- 38,399 · -30.4%
- By 2100
- 24,646 · -55.3%
Race, ethnicity, and origin ACS 2023
- Neighborhood character
- Predominantly White (94%)
- Race & ethnicity
- White 94% Two or more races 3% Hispanic / Latino 3%
- Common ancestry
- Portuguese 18% Romanian 6% Lithuanian 4%
- Foreign-born
- 2% · Canada
- Languages at home
- 97% English-only · Spanish 2%
Political lean MEDSL · Chisago
- 2024 margin
- Solid R (+31.4) · D 33.5% · R 64.9% · Other 1.6%
- 2008→2024 swing
- -21.2pp toward R · 2008: -10.3pp · 2024: -31.4pp
- All cycles
- 2024: R+31.4 2020: R+29.2 2016: R+30.5 2012: R+12.6 2008: R+10.3
Not yet ingested
- Civics
- —
Market trends
- HPI YoY
- ▼ -79.38%
- Current HPI
- 308.8275
- Rent YoY
- —
- Metro
- —
- State GDP YoY
- ▲ 2.41%
- F500 in state
- 34
Industry mix (Fortune 500 HQ in MN)
| Industry | F500 HQs | Revenue |
|---|---|---|
| Healthcare | 2 | $407B |
|
||
| Retail | 2 | $150B |
|
||
| Consumer Goods | 2 | $32B |
|
||
| Industrial Machinery | 2 | $6B |
|
||
| Agriculture | 1 | $40B |
|
||
| Healthcare / Medical Devices | 1 | $32B |
|
||
Price history
+50.1% since first listed23 events — show timeline
- 2026-06-11 Sold (MLS) $240,000 NORTHSTARMLS as Distributed by MLS Grid
- 2026-05-28 Pending — NORTHSTARMLS as Distributed by MLS Grid
- 2026-05-21 Contingent — NORTHSTARMLS as Distributed by MLS Grid
- 2026-05-15 Listed $268,900 NORTHSTARMLS as Distributed by MLS Grid
- 2026-05-01 Listed $268,000 NORTHSTARMLS as Distributed by MLS Grid
- 2026-04-28 Coming Soon — NORTHSTARMLS as Distributed by MLS Grid
- 2014-07-18 Sold (Public Records) $152,500 Public Records
- 2014-07-17 Sold (MLS) $152,500 LSAR
- 2014-07-17 Sold (MLS) $152,500 RASM
- 2014-07-17 Sold (MLS) $152,500 NORTHSTARMLS as Distributed by MLS Grid
- 2014-05-15 Price Changed $158,900 NORTHSTARMLS as Distributed by MLS Grid
- 2014-05-15 Contingent — NORTHSTARMLS as Distributed by MLS Grid
- 2014-05-15 Pending — NORTHSTARMLS as Distributed by MLS Grid
- 2014-03-19 Listed $169,900 NORTHSTARMLS as Distributed by MLS Grid
- 2014-03-18 Listed $158,900 LSAR
- 2014-03-18 Listed $158,900 RASM
- 2009-07-06 Sold (Public Records) $72,950 Public Records
- 2009-07-06 Sold (Public Records) $72,950 Public Records
- 2009-06-30 Sold (MLS) $145,900 NORTHSTARMLS as Distributed by MLS Grid
- 2009-05-28 Listing Removed — NORTHSTARMLS as Distributed by MLS Grid
- 2009-03-02 Listed $149,900 NORTHSTARMLS as Distributed by MLS Grid
- 2009-03-01 Listing Removed — NORTHSTARMLS as Distributed by MLS Grid
- 2008-08-28 Listed $159,900 NORTHSTARMLS as Distributed by MLS Grid
Property tax history
+4.7%/yrLatest (2025): $3,372 · +4.3% YoY. Source: county tax records.
Cash-flow waterfall
monthlySold comps — $/sqft
last 12 mo · ≤1 miLoading sold comps…