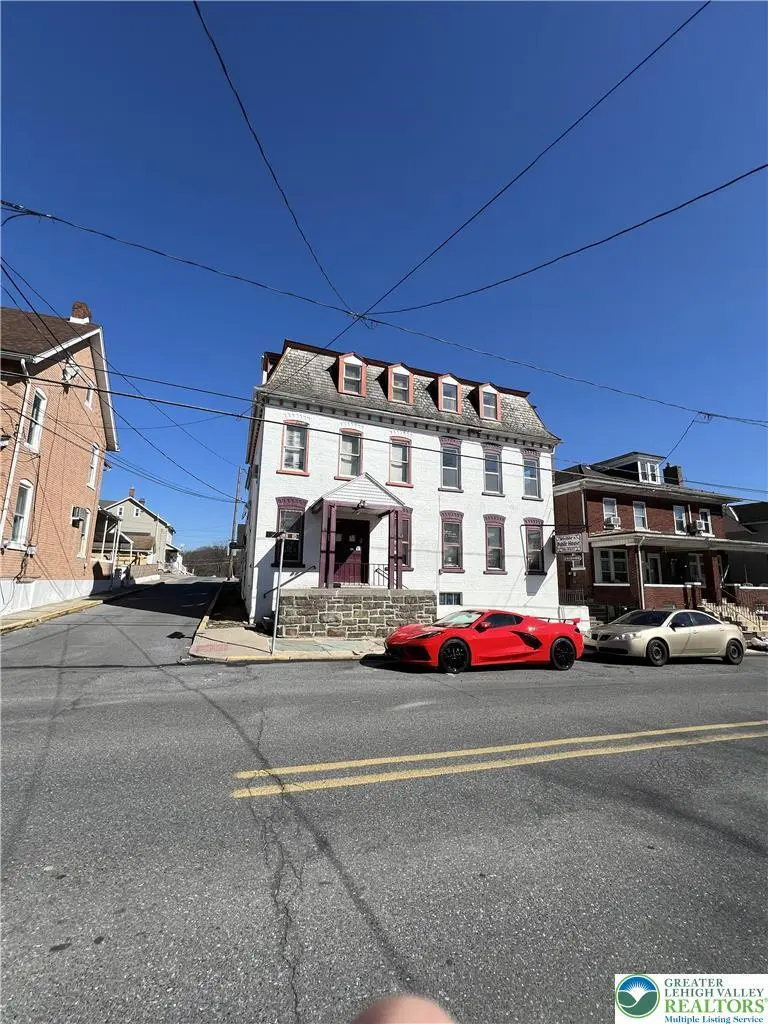
129 Howertown Rd Unit 129 and 131
Catasauqua, PA 18032
$430,000B
6 bd · 4.0 ba ·
6,140 sqft ·
Built 1870
· MultiFamily
· Active
· 14 DOM
Cashflow @ list (25.0% down · 7.5%)
Estimated rent
$6,017/mo
Mortgage (P&I)
−$2,255
Tax + insurance
−$717
HOA
−$0
Vac / Maint / Mgmt
−$1,264
Net cashflow
$1,782/mo
Annual
$21,382/yr
Cap rate
11.27%
Cash-on-cash
17.76%
DSCR
1.79
1% rule
1.40%
Cash to close
$120,400
Investor read
- This is a 6-bed/4.0-bath multifamily listed at $430k. Condition is rated fair.
- At list price, monthly cash flow is $2k ($21k/yr) — positive.
- The deal already cash-flows at list — no discount required.
- Meets the 1% rule at list price ($6k rent vs $430k).
- Only 14 days on market — expect competitive offers; lowballing is unlikely to land.
- Local home prices are declining (-3.0%/yr); year-one equity from $3k of loan paydown is wiped out by about $13k of value loss. Plan a longer hold.
- Location reads 75/100 on livability (#443 in PA, #4,039 nationally) — a middle-class / working-renter tenant base. Strengths: cost of living A+, housing A+, health & safety A+; Watch: schools C-, amenities F, commute F.
- Catasauqua Area SD (suburban): math 23% / reading 41% proficiency, ranked #431 of 539 in PA (top 80%) — families likely to look elsewhere, expect single-tenant / working-renter base with shorter leases.
- Watch-outs: built in 1870 — expect roof / HVAC / electrical / plumbing capex.
- Market conditions: 49 active listings in the ZIP; solid renter incomes; 765 units permitted in Lehigh County in 2024 (286 in 5+ unit buildings).
- Lehigh County population projected at +21% by 2050 — long-run rental-demand tailwind backs the buy-and-hold thesis.
- 2 sale attempts with the ask held roughly flat each time — persistent listings suggest the price (not the market) is what's stuck; bring a comps-based counter.
- At projected returns (-3.0% appreciation + 3.0% rent growth), your $120k cash investment doubles in ~7 years — after that, you're playing with house money.
- Cap rate 11.3% vs local median 4.9% in Catasauqua — top-decile yield for the area; either an underpriced asset or a hidden risk that comps aren't pricing in. Stress-test before assuming the spread holds.
- At $6,017/mo this rent would consume 89% of the median local household income ($81k/yr) (locally 221% of renters already pay >50% of income on rent) — very limited rent-growth headroom before tenants either downsize or default.
Questions for listing agent
- Have any recent inspections been done? Can we get a copy of the seller's disclosures and any deferred-maintenance estimates?
- Built in 1870 — when were the roof, HVAC, electrical panel, plumbing, and water heater last replaced?
- Is there a deadline driving the sale (1031 exchange, divorce, estate, relocation)? That informs how much negotiation room exists.
- What's the average days-on-market for RENTAL listings here right now (not sales)? A rising rental-DOM trend means longer vacancies and softer asking-rent achievability than the comps imply.
- What's the recent tenant-quality profile in this submarket — average credit score on applications, eviction rate, late-payment / NSF rate, and stable-employment percentage? A property-management company in the area should have these aggregated.
- How much new apartment / multifamily construction is in the pipeline within 1–3 miles? Heavy new supply (>2% of stock underway) typically softens rents 12–24 months out; light construction supports rent growth.
Repairs flagged (vision-AI assessment)
- Major: Kitchen cabinets — Severe wear and tear, likely in need of replacement.
- Major: Bathroom fixtures — Severe wear and tear, likely in need of replacement.
- Major: Exterior siding — Peeling paint and general wear and tear, likely in need of replacement.
- Major: Flooring — Severe wear and tear, likely in need of replacement.
- Major: Paint — Severe wear and tear, likely in need of replacement.
- Major: HVAC — No visible issues, but the age of the system is unknown.
CashFlowRE · CFR-VAFBGA9DM7W06K
· Data 2 weeks ago
cashflowre.app · 2026-05-29