 Multi-family
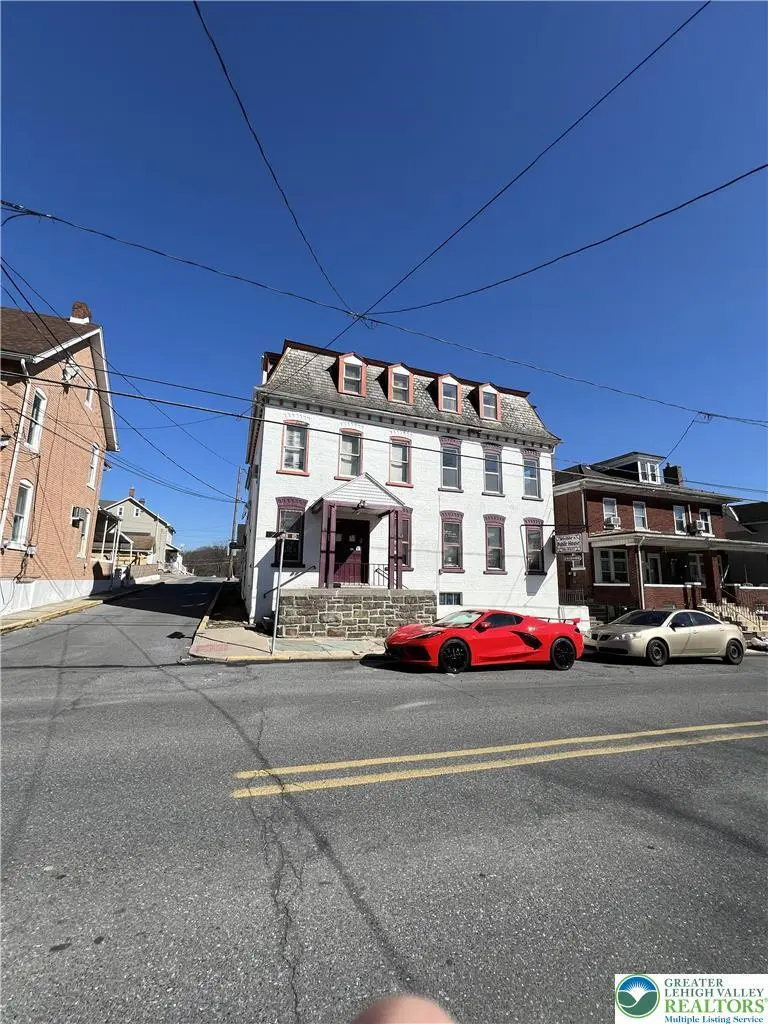
129 Howertown Rd Unit 129 and 131 · Catasauqua, PA
Flood risk No data
- FEMA flood zone
- —
- Chance of flooding over 30 yrs
- —
- Est. flood insurance / yr
- —
Fire risk No data
- Est. fire insurance / yr
- —
Heat risk No data
- Hot days now (above threshold)
- —
- Hot days in 30 yrs
- —
Wind risk No data
- Chance of severe wind over 30 yrs
- —
Air-quality risk No data
- Unhealthy air days now
- —
- Unhealthy air days in 30 yrs
- —
Risk factors via First Street. Map © Google.
Why this score? — see what drove the B grade
The composite is a weighted blend of 9 inputs, each scored 0–100. Each bar is that input's sub-score; the figure is the points it added to the 100-point composite (weight × sub-score).
- Cash flow +30.0/30.0
- ARV discount +10.6/15.0
- DSCR +10.0/10.0
- 1% rule +9.0/10.0
- Livability +3.8/5.0
- Schools +2.8/10.0
- Rent growth +2.5/5.0
- Condition / age +2.2/5.0
- Appreciation +0.0/10.0
$430,000
🖨 Deal sheet 📄 Offer letter ✓ Due diligence
Multi-family units
County records classify this as Multi-Family (2-4 Unit). Listing-text estimate: 1 unit. estimate disagrees with records
Listing remarks
Mixed-use bar/restaurant; (2) 2-3 bed apartments; 2-car detached garage. All in one in Catasauqua! Potential annual gross income of $88,800! Open up your dream bar/restaurant or keep it as a money maker and lease it out! Large bar/restaurant space has a fully equipped commercial kitchen, 2 bathroom, and two custom built real wood bar tops! There is a small bar space, game room area, restaurant seating area, and a larger main bar area. Both apartments have private entrances and they are both 2 stories! Very large apartments perfect for long or mid-term tenants. There is a detached 2-car garage that can be rented out as well. Liquor license not included in the sale; reach out to the listing a
Key facts
- Game room area
- Private entrances
- Detached garage
Tags
Property features AI
Finance
- Financial info: Maintenance expense: $5,000; Operating expense: $22,000; Water/sewer expense: $2,300; Electric expense: $560; Insurance expense: $3,000; Other expenses: $1,200
Exterior
- Parking: Detached garage; On-street parking; Off-street parking; Total parking for 6 vehicles
- Utilities: Public water; Public sewer
- Home design: 3 stories
- Construction: Brick and stone construction
- Exterior features: Public records list lot size as 6,055 sq ft (0.139 acres); Zoning: R2
Interior
- Bedrooms: 3-unit building (total units: 3)
- Flooring: Hardwood
- Bathrooms: 4 full bathrooms (total)
- Heating & cooling: Electric heating; Gas heating; Wall/window cooling units
- Interior features: Hardwood floors
Neighborhood map
What this means for you Summary
Snapshot
- This is a 6-bed/4.0-bath multifamily listed at $430k. Condition is rated fair.
Deal economics
- At list price, monthly cash flow is $2k ($21k/yr) — positive.
- The deal already cash-flows at list — no discount required.
- Meets the 1% rule at list price ($6k rent vs $430k).
- Cap rate 11.3% vs local median 4.9% in Catasauqua — top-decile yield for the area; either an underpriced asset or a hidden risk that comps aren't pricing in. Stress-test before assuming the spread holds.
Location & tenants
- Location reads 75/100 on livability (#443 in PA, #4,039 nationally) — a middle-class / working-renter tenant base. Strengths: cost of living A+, housing A+, health & safety A+; Watch: schools C-, amenities F, commute F.
- Catasauqua Area SD (suburban): math 23% / reading 41% proficiency, ranked #431 of 539 in PA (top 80%) — families likely to look elsewhere, expect single-tenant / working-renter base with shorter leases.
- Market conditions: 49 active listings in the ZIP; solid renter incomes; 765 units permitted in Lehigh County in 2024 (286 in 5+ unit buildings).
- At $6,017/mo this rent would consume 89% of the median local household income ($81k/yr) (locally 221% of renters already pay >50% of income on rent) — very limited rent-growth headroom before tenants either downsize or default.
Forward outlook
- Local home prices are declining (-3.0%/yr); year-one equity from $3k of loan paydown is wiped out by about $13k of value loss. Plan a longer hold.
- Lehigh County population projected at +21% by 2050 — long-run rental-demand tailwind backs the buy-and-hold thesis.
- At projected returns (-3.0% appreciation + 3.0% rent growth), your $120k cash investment doubles in ~7 years — after that, you're playing with house money.
Negotiation context
- Only 14 days on market — expect competitive offers; lowballing is unlikely to land.
- 2 sale attempts with the ask held roughly flat each time — persistent listings suggest the price (not the market) is what's stuck; bring a comps-based counter.
Risks & watch-outs
- Watch-outs: built in 1870 — expect roof / HVAC / electrical / plumbing capex.
Questions for the listing agent
- Have any recent inspections been done? Can we get a copy of the seller's disclosures and any deferred-maintenance estimates?
- Built in 1870 — when were the roof, HVAC, electrical panel, plumbing, and water heater last replaced?
- Is there a deadline driving the sale (1031 exchange, divorce, estate, relocation)? That informs how much negotiation room exists.
- What's the average days-on-market for RENTAL listings here right now (not sales)? A rising rental-DOM trend means longer vacancies and softer asking-rent achievability than the comps imply.
- What's the recent tenant-quality profile in this submarket — average credit score on applications, eviction rate, late-payment / NSF rate, and stable-employment percentage? A property-management company in the area should have these aggregated.
- How much new apartment / multifamily construction is in the pipeline within 1–3 miles? Heavy new supply (>2% of stock underway) typically softens rents 12–24 months out; light construction supports rent growth.
Investment metrics
- 1% rule
- 1.40% ✓
- Cap rate
- 11.27%
- Cash-on-cash
- 17.76%
- DSCR
- 1.79
- GRM
- 6.0
CMA / ARV
- ARV (median comp)
- $461,919
- List price
- $430,000
- Delta
- 5.00%
- Verdict
- FAIR
- Comps
- 1 within 2.0 mi
Projected returns pro-forma
-3.0% appreciation · 3.0% rent growth · sell at horizon
- IRR
- 9.3%
- Equity multiple
- 1.36×
- Total profit
- $43,896
- Equity at exit
- $64,114
- IRR
- 18.4%
- Equity multiple
- 2.53×
- Total profit
- $184,721
- Equity at exit
- $37,179
Cash invested: $120,400 (down + closing). Projections, not guarantees.
Landlord ↔ Tenant lean methodology
- Overall (STATE)
- 62 Landlord-Friendly
- State Pennsylvania
- 62 Landlord-Friendly · EVEN
- County
- — inherits STATE
- City
- — inherits STATE
ZIP-level market 18032
- Home prices YoY
- -34.7%
- Active inventory
- 49
- Price-to-rent
- 17.9×
Monthly cashflow live
- Estimated rent
- $6,017 medium interval (Pro) →
- Mortgage (P&I)
- −$2,255
- Tax est. 1.5%
- −$538 /mo · $6,450/yr
- Insurance
- −$179
- HOA
- −$0
- Vacancy / Maint / Mgmt
- −$1,264
- Net cashflow
- $1,782
Break-even live
3-unit breakdown (identical units grouped — click to expand)
| Units | Beds | Baths | Est. rent |
|---|---|---|---|
| 3× units | 2 | 1 | $6,018 |
| #1 | 2 | 1 | $2,006 |
| #2 | 2 | 1 | $2,006 |
| #3 | 2 | 1 | $2,006 |
| Total (3 units) | $6,017 | ||
UW: 25.0% down · 7.5% · 30yr · 1.5% tax · 5.0% vac · 8.0% maint · 8.0% mgmt
Financing live
Cash to close
- Down payment
- $107,500
- Closing costs
- $12,900
- Reserves months
- —
- Total cash needed
- —
Loan-product check · same deal, 3 products live
Conventional
25% down · 7.5% · 30yr
- Down + closing
- —
- Monthly P&I
- —
- Monthly cashflow
- —
- DSCR
- —
- Eligible?
- —
Personal DTI + credit; lowest rate.
DSCR
20% down · 8.5% · 30yr
- Down + closing
- —
- Monthly P&I
- —
- Monthly cashflow
- —
- DSCR
- —
- Eligible?
- —
No personal income docs; deal must DSCR.
Hard money
10% down · 12.0% · 12mo
- Down + closing
- —
- Monthly P&I
- —
- Monthly cashflow
- —
- DSCR
- —
- Eligible?
- —
Short-term bridge; refi at stabilization.
Listing history 8 events
-
2026-06-03days on market $430,000 Active 14 DOM
-
2026-06-02days on market $430,000 Active 13 DOM
-
2026-06-01days on market $430,000 Active 12 DOM
-
2026-05-31days on market $430,000 Active 11 DOM
-
2026-05-31days on market $430,000 Active 10 DOM
-
2026-05-16historical
-
2026-05-13price $459,000
-
2026-05-01$485,000 Active
ⓘ Source: listings_history table (triggers on properties + properties_extension) + one-shot
backfill from property_details.listing_events for pre-trigger history.
Nearby sold comps map
Loading sold comps map…
Walkable amenities ~0.75 mi
Loading nearby amenities…
Taxation est. · year 1
- Rental income
- $72,204
- − Mortgage interest
- −$24,087
- − Property taxes
- −$6,450
- − Insurance
- −$2,150
- − Repairs & maintenance
- −$5,776
- − Management
- −$5,776
- − Depreciation
- −$12,509
- Taxable income
- $15,456
- Est. tax owed @ 24.0%
- −$3,709
- After-tax cash flow
- $17,672/yr
For passive investors: Depreciation is non-cash, so a rental often shows a tax loss while cash-flowing — sheltering income. Rental losses are passive: they offset passive income freely, and up to $25,000/yr can offset ordinary (W-2) income if you actively participate and your MAGI is under $100k (phasing out to $0 by $150k); unused losses carry forward. On sale, claimed depreciation is recaptured at up to 25%, and gains may owe capital-gains tax (a 1031 exchange can defer both). Figures are a year-1 estimate at your 24.0% rate — not tax advice; consult a CPA.
Condition & rehab AI · 13 photos
This property requires extensive renovations to bring it up to modern standards, but it has significant potential for resale and rental value with the right updates.
Repairs flagged
- Major Kitchen cabinets — Severe wear and tear, likely in need of replacement.
- Major Bathroom fixtures — Severe wear and tear, likely in need of replacement.
- Major Exterior siding — Peeling paint and general wear and tear, likely in need of replacement.
- Major Flooring — Severe wear and tear, likely in need of replacement.
- Major Paint — Severe wear and tear, likely in need of replacement.
- Major HVAC — No visible issues, but the age of the system is unknown.
- Major Electrical — No visible issues, but the age of the system is unknown.
Value-add opportunities
- Resale New kitchen cabinets and countertops — Fresh, modern kitchen will attract more buyers and increase the home's value.
- Resale New bathroom fixtures — Fresh, modern bathrooms will attract more buyers and increase the home's value.
- Resale New exterior siding and paint — Fresh, modern exterior will attract more buyers and increase the home's value.
- Resale New flooring — Fresh, modern flooring will attract more buyers and increase the home's value.
- Resale New paint — Fresh, modern paint will attract more buyers and increase the home's value.
- Resale New HVAC and electrical systems — Fresh, modern systems will attract more buyers and increase the home's value.
Renovation cost estimate screening
| Repair item | Severity | Est. cost |
|---|---|---|
| Kitchen cabinets · Severe wear and tear, likely in need of replacement. | Major | $15,000–50,000 |
| Bathroom fixtures · Severe wear and tear, likely in need of replacement. | Major | $15,000–50,000 |
| Exterior siding · Peeling paint and general wear and tear, likely in need of replacement. | Major | $15,000–50,000 |
| Flooring · Severe wear and tear, likely in need of replacement. | Major | $15,000–50,000 |
| Paint · Severe wear and tear, likely in need of replacement. | Major | $15,000–50,000 |
| HVAC · No visible issues, but the age of the system is unknown. | Major | $15,000–50,000 |
| Electrical · No visible issues, but the age of the system is unknown. | Major | $15,000–50,000 |
| Total estimated repair cost · 7 items | $105,000–350,000 |
Value-add ROI direction
- Resale New kitchen cabinets and countertops — Fresh, modern kitchen will attract more buyers and increase the home's value. ↑
- Resale New bathroom fixtures — Fresh, modern bathrooms will attract more buyers and increase the home's value. ↑
- Resale New exterior siding and paint — Fresh, modern exterior will attract more buyers and increase the home's value. ↑
- Resale New flooring — Fresh, modern flooring will attract more buyers and increase the home's value. ↑
- Resale New paint — Fresh, modern paint will attract more buyers and increase the home's value. ↑
- Resale New HVAC and electrical systems — Fresh, modern systems will attract more buyers and increase the home's value. ↑
ⓘ Cost ranges are severity-bucket heuristics (US national rule-of-thumb). Get contractor quotes + a written scope before underwriting a rehab budget.
Schools (NCES district)
- District
- Catasauqua Area SD
- NCES district ID
- 4205160
- Math proficiency
- 23% ▼ -15.00%
- Reading proficiency
- 41% ▼ -21.00%
- Median HH income
- $53,073
- Composite
- 28.09/100
- National rank
- #6832
- State rank
- #431 of 539 in PA
Livability — Catasauqua
- Score
- 75/100
- State rank
- #443
- US rank
- #4039
Category grades
Schools grade is shown separately in the Schools card above.
Census & demographics
- Census place
- Catasauqua, PA
- County
- Lehigh County · 333,019 people
- City population
- 9,555
- Metro
- Allentown-Bethlehem-Easton, PA-NJ
- Population (ZIP)
- 9,555
- Household income
- $81,098
- Rent vs Own
- Severe rent burden
- 221.0
Population outlook (Lehigh County) Hauer SSP2
- Today (2025)
- 392,957 people
- By 2030
- 408,319 · +3.9%
- By 2040
- 440,007 · +12.0%
- By 2050
- 475,940 · +21.1%
- By 2075
- 590,448 · +50.3%
- By 2100
- 690,314 · +75.7%
Race, ethnicity, and origin ACS 2023
- Neighborhood character
- Predominantly White (79%)
- Race & ethnicity
- White 79% Hispanic / Latino 15% Two or more races 12% Black 3%
- Hispanic origin (detail)
- Puerto Rican 10% Dominican 1%
- Common ancestry
- Danish 4% Polish 3% Romanian 2%
- Foreign-born
- 4% · Canada
- Languages at home
- 91% English-only · Spanish 8%
Political lean MEDSL · Lehigh
- 2024 margin
- Toss-up / Even · D 50.7% · R 48.0% · Other 1.2%
- 2008→2024 swing
- -12.9pp toward R · 2008: 15.6pp · 2024: 2.7pp
- All cycles
- 2024: D+2.7 2020: D+7.6 2016: D+4.4 2012: D+7.5 2008: D+15.6
Not yet ingested
- Civics
- —
Market trends
- HPI YoY
- ▼ -159.00%
- Current HPI
- 299.4376
- Rent YoY
- —
- Metro
- Allentown-Bethlehem-Easton, PA-NJ
- State GDP YoY
- ▲ 1.68%
- F500 in state
- 34
Industry mix (Fortune 500 HQ in PA)
| Industry | F500 HQs | Revenue |
|---|---|---|
| Healthcare | 2 | $309B |
|
||
| Insurance | 2 | $27B |
|
||
| Telecommunications / Media | 1 | $124B |
|
||
| Industrial Distribution | 1 | $22B |
|
||
| Financial Services | 1 | $20B |
|
||
| Chemicals / Materials | 1 | $18B |
|
||
Price history
-11.3% since first listed5 events — show timeline
- 2026-06-04 Listing Removed — GLVRMLS
- 2026-05-20 Listed $430,000 GLVRMLS
- 2026-05-16 Listing Removed — GLVRMLS
- 2026-05-13 Price Changed $459,000 GLVRMLS
- 2026-05-01 Listed $485,000 GLVRMLS
Cash-flow waterfall
monthlySold comps — $/sqft
last 12 mo · ≤1 miLoading sold comps…