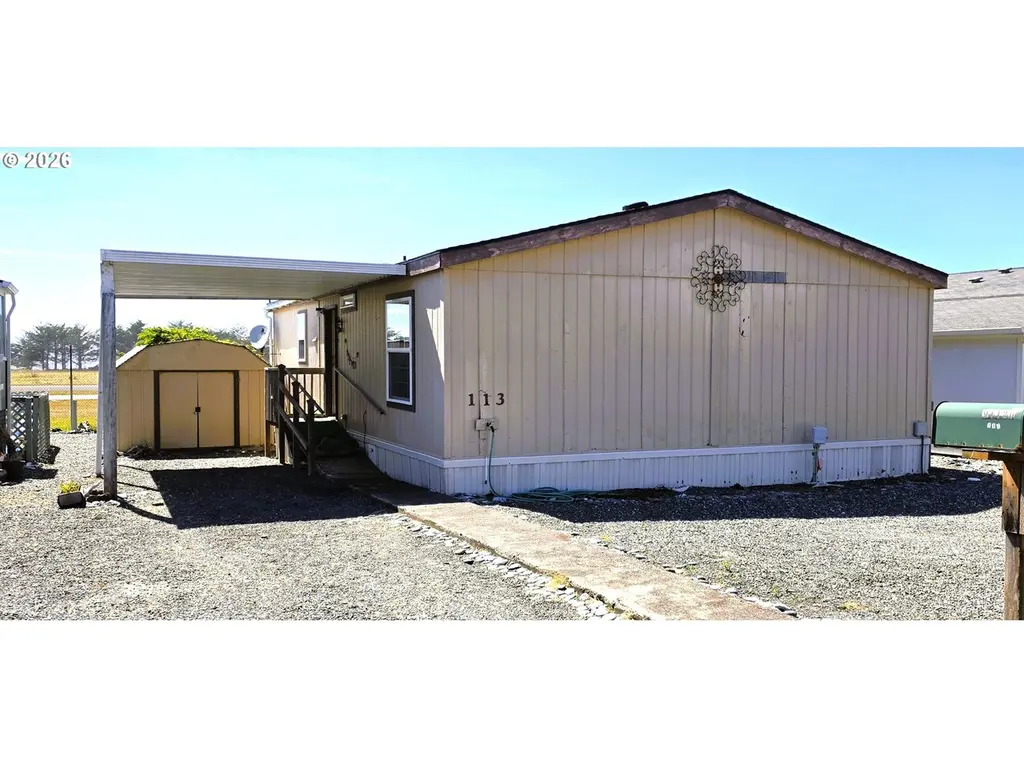
94120 Strahan St #113
Gold Beach, OR 97444
$120,000B+
2 bd · 2.0 ba ·
1,080 sqft ·
Built 1995
· Manufactured
· Active
· 10 DOM
Cashflow @ list (25.0% down · 7.5%)
Estimated rent
$1,800/mo
Mortgage (P&I)
−$629
Tax + insurance
−$98
HOA
−$0
Vac / Maint / Mgmt
−$378
Net cashflow
$695/mo
Annual
$8,334/yr
Cap rate
13.24%
Cash-on-cash
24.80%
DSCR
2.10
1% rule
1.50%
Cash to close
$33,600
Investor read
- This is a 2-bed/2.0-bath manufactured listed at $120k.
- At list price, monthly cash flow is $695 ($8k/yr) — positive.
- The deal already cash-flows at list — no discount required.
- Meets the 1% rule at list price ($2k rent vs $120k).
- Only 10 days on market — expect competitive offers; lowballing is unlikely to land.
- Local home prices are declining (-3.0%/yr); year-one equity from $830 of loan paydown is wiped out by about $4k of value loss. Plan a longer hold.
- Location reads 70/100 on livability (#129 in OR) — a middle-class / working-renter tenant base. Strengths: crime A+, health & safety A+, cost of living B; Watch: amenities F, commute F, employment F.
- Central Curry SD 1 (town): math 42% / reading 54% proficiency, ranked #53 of 183 in OR (top 29%) — families likely to look elsewhere, expect single-tenant / working-renter base with shorter leases.
- Zoned schools: Riley Creek Elementary School (math 22% / reading 22%, grade F, #352 of 412 statewide, top 85%, 310 students, 66% FRL); Gold Beach High School (math 30% / reading 50%, grade F, #69 of 143 statewide, top 54%, 123 students, 67% FRL).
- Zoned-school proficiency averages 31% at this address vs 48% district-wide (-17 pts) — the specific schools serving this property underperform the Central Curry SD 1 average; the district grade overstates school quality for this exact location.
- Market conditions: 168 active listings in the ZIP; 1 comparable units currently listed for rent nearby; 52 units permitted in Curry County in 2024 (0 in 5+ unit buildings).
- Curry County population projected at -14% by 2050 — secular population decline; favor cash flow + early exit over multi-decade hold.
- 4 sale attempts since 12y ago with the ask held roughly flat each time — persistent listings suggest the price (not the market) is what's stuck; bring a comps-based counter.
- Current owner paid $50k; list at $120k implies a 140% gain — meaningful room to come down on a strong offer.
- At projected returns (-3.0% appreciation + 3.0% rent growth), your $34k cash investment doubles in ~5 years — after that, you're playing with house money.
- Cap rate 13.2% vs local median 2.3% in Gold Beach — top-decile yield for the area; either an underpriced asset or a hidden risk that comps aren't pricing in. Stress-test before assuming the spread holds.
Questions for listing agent
- Is there a deadline driving the sale (1031 exchange, divorce, estate, relocation)? That informs how much negotiation room exists.
- Schools are D-rated, which usually means shorter tenancies and higher turnover. Who's the typical renter profile here, and what's been the actual vacancy rate?
- What's the average days-on-market for RENTAL listings here right now (not sales)? A rising rental-DOM trend means longer vacancies and softer asking-rent achievability than the comps imply.
- What's the recent tenant-quality profile in this submarket — average credit score on applications, eviction rate, late-payment / NSF rate, and stable-employment percentage? A property-management company in the area should have these aggregated.
- How much new for-sale + rental construction is in the pipeline within 1–3 miles? Heavy new supply typically softens prices + rents 12–24 months out; constrained supply supports both.
CashFlowRE · CFR-VANNSFCBGEB761
· Data 11 h ago
cashflowre.app · 2026-05-29