94120 Strahan St #113 · Gold Beach, OR
Flood risk 1/10 · Minimal
- FEMA flood zone
- X (unshaded)
- Chance of flooding over 30 yrs
- 0.0%
- Est. flood insurance / yr
- $507 – $1,088
Fire risk 3/10 · Minor
- Est. fire insurance / yr
- $498 – $926
Heat risk 2/10 · Minimal
- Hot days now (above 81°F)
- 8 days/yr
- Hot days in 30 yrs
- 24 days/yr
Wind risk 1/10 · Minimal
- Chance of severe wind over 30 yrs
- —
Air-quality risk 7/10 · Major
- Unhealthy air days now
- 10 days/yr
- Unhealthy air days in 30 yrs
- 12 days/yr
Risk factors via First Street. Map © Google.
Why this score? — see what drove the B+ grade
The composite is a weighted blend of 9 inputs, each scored 0–100. Each bar is that input's sub-score; the figure is the points it added to the 100-point composite (weight × sub-score).
- Cash flow +30.0/30.0
- ARV discount +15.0/15.0
- 1% rule +10.0/10.0
- DSCR +10.0/10.0
- Schools +4.3/10.0
- Livability +3.5/5.0
- Rent growth +2.5/5.0
- Condition / age +2.5/5.0
- Appreciation +0.0/10.0
$120,000
🖨 Deal sheet (PDF) 📄 Offer letter ✓ Due diligence
Listing remarks MLS
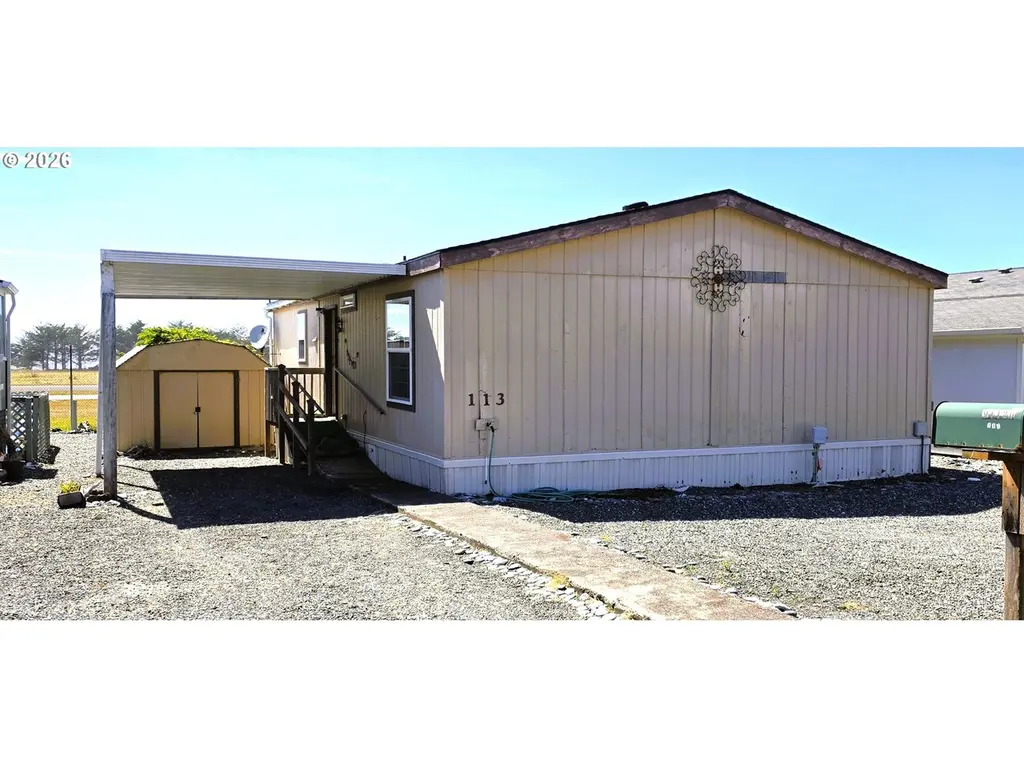
1995 Double Wide Manufactured Home by Fleetwood- sits along the airstrip and has an ocean view. Nice yard in front of home with plenty of room for outdoor living. There is also a greenhouse and a nice 10X12 storage shed. 4 year old roof. The unit has been sparingly lived in so carpet and paint feel new! Walk in Jacuzzi tub provides your own master bath spa feel! Relax, move in... this unit is ready to go!
Key facts
- Ocean view
- Good parking space
- Covered carport
Tags
Property features AI
Finance
- Other: Lot rent charged monthly
- Financial info: Land lease in effect (monthly lot rent); Land lease expiration date noted
- HOA & community: Park utilities (water, sewer, trash) provided by association; Gold Beach Mobile Home Park; Park allows two small pets (up to 25 lbs)
Exterior
- Parking: Carport; Driveway; One covered parking space (carport)
- Utilities: Electric hot water and electric fuel; Public water; Public sewer; Fiber optic internet available
- Home design: Manufactured home in a park (Fleetwood); Residential property; Single-story (main living on one level); Built in 1995; Entry/main level is main level; Property listed as fixer condition
- Construction: Composition roof; Pillar/post/pier foundation with skirting; Manufacturer: Fleetwood
- Exterior features: Deck; Tool shed; Ocean and territorial views; Paved road access; Other exterior description
Interior
- Kitchen: Dishwasher; Disposal; Free-standing range; Free-standing refrigerator; Vaulted ceiling in kitchen
- Bedrooms: Primary bedroom on main level with vaulted ceiling, walk-in closet, and wall-to-wall carpet; Second bedroom on main level with vaulted ceiling and wall-to-wall carpet; Third bedroom on main level with vaulted ceiling and wall-to-wall carpet
- Flooring: Wall-to-wall carpet throughout main living areas and bedrooms
- Bathrooms: Two full bathrooms (both on main level)
- Heating & cooling: Forced-air heating; No central air conditioning
- Interior features: Main-floor bedroom and bath accessibility; One-level layout; Jetted tub and soaking tub; Vaulted ceilings; Wall-to-wall carpet; Washer and dryer included; Double-pane windows with vinyl frames; Crawl space basement
- Laundry & utility: Main-level laundry area with washer and dryer
Neighborhood map
What this means for you Summary
Snapshot
- This is a 2-bed/2.0-bath manufactured listed at $120k.
Deal economics
- At list price, monthly cash flow is $695 ($8k/yr) — positive.
- The deal already cash-flows at list — no discount required.
- Meets the 1% rule at list price ($2k rent vs $120k).
- Cap rate 13.2% vs local median 2.3% in Gold Beach — top-decile yield for the area; either an underpriced asset or a hidden risk that comps aren't pricing in. Stress-test before assuming the spread holds.
Location & tenants
- Location reads 70/100 on livability (#129 in OR) — a middle-class / working-renter tenant base. Strengths: crime A+, health & safety A+, cost of living B; Watch: amenities F, commute F, employment F.
- Central Curry SD 1 (town): math 42% / reading 54% proficiency, ranked #53 of 183 in OR (top 29%) — families likely to look elsewhere, expect single-tenant / working-renter base with shorter leases.
- Zoned schools: Riley Creek Elementary School (math 22% / reading 22%, grade F, #352 of 412 statewide, top 85%, 310 students, 66% FRL); Gold Beach High School (math 30% / reading 50%, grade F, #69 of 143 statewide, top 54%, 123 students, 67% FRL).
- Zoned-school proficiency averages 31% at this address vs 48% district-wide (-17 pts) — the specific schools serving this property underperform the Central Curry SD 1 average; the district grade overstates school quality for this exact location.
- Market conditions: 168 active listings in the ZIP; 1 comparable units currently listed for rent nearby; 52 units permitted in Curry County in 2024 (0 in 5+ unit buildings).
Forward outlook
- Local home prices are declining (-3.0%/yr); year-one equity from $830 of loan paydown is wiped out by about $4k of value loss. Plan a longer hold.
- Curry County population projected at -14% by 2050 — secular population decline; favor cash flow + early exit over multi-decade hold.
- At projected returns (-3.0% appreciation + 3.0% rent growth), your $34k cash investment doubles in ~5 years — after that, you're playing with house money.
Negotiation context
- Only 10 days on market — expect competitive offers; lowballing is unlikely to land.
- 4 sale attempts since 12y ago with the ask held roughly flat each time — persistent listings suggest the price (not the market) is what's stuck; bring a comps-based counter.
- Current owner paid $50k; list at $120k implies a 140% gain — meaningful room to come down on a strong offer.
Questions for the listing agent
- Is there a deadline driving the sale (1031 exchange, divorce, estate, relocation)? That informs how much negotiation room exists.
- Schools are D-rated, which usually means shorter tenancies and higher turnover. Who's the typical renter profile here, and what's been the actual vacancy rate?
- What's the average days-on-market for RENTAL listings here right now (not sales)? A rising rental-DOM trend means longer vacancies and softer asking-rent achievability than the comps imply.
- What's the recent tenant-quality profile in this submarket — average credit score on applications, eviction rate, late-payment / NSF rate, and stable-employment percentage? A property-management company in the area should have these aggregated.
- How much new for-sale + rental construction is in the pipeline within 1–3 miles? Heavy new supply typically softens prices + rents 12–24 months out; constrained supply supports both.
Investment metrics
- 1% rule
- 1.50% ✓
- Cap rate
- 13.24%
- Cash-on-cash
- 24.80%
- DSCR
- 2.10
- GRM
- 5.6
CMA / ARV
- ARV (on-the-fly)
- $150,120
- Comps found
- 3
Show comp detail 3 sales within ~0.75 mi
| Address | Dist | Beds/Ba | Sqft | Sold | Price | $/sf | Match |
|---|---|---|---|---|---|---|---|
| 94120 Strahan St #15 | 0.00mi | 3/2.0 (+1) | 1,123 (+4%) | 4mo | $177,000 | $158 | 85 |
| 94120 Strahan St #119 | 0.00mi | 2/2.0 | 1,188 (+10%) | 13mo | $165,000 | $139 | 73 |
| 29515 Myrtle Ln | 0.67mi | 3/2.0 (+1) | 940 (-13%) | 18mo | $125,000 | $133 | 27 |
Match score weights: distance 35% · size 25% · config 20% · recency 20%. Top-matched comps best support the ARV.
Projected returns pro-forma
-3.0% appreciation · 3.0% rent growth · sell at horizon
- IRR
- 18.2%
- Equity multiple
- 1.74×
- Total profit
- $24,755
- Equity at exit
- $17,892
- IRR
- 26.6%
- Equity multiple
- 3.33×
- Total profit
- $78,372
- Equity at exit
- $10,375
Cash invested: $33,600 (down + closing). Projections, not guarantees.
Landlord ↔ Tenant lean methodology
- Overall (STATE)
- 28 Tenant-Leaning
- State Oregon
- 28 Tenant-Leaning · D+6
- County
- — inherits STATE
- City
- — inherits STATE
ZIP-level market 97444
- Home prices YoY
- -17.0%
- Active inventory
- 168
- Price-to-rent
- 5.6×
Monthly cashflow live
- Estimated rent
- $1,800 medium interval (Pro) →
- Mortgage (P&I)
- −$629
- Tax from tax record
- −$48 /mo · $578/yr
- Insurance
- −$50
- HOA
- −$0
- Vacancy / Maint / Mgmt
- −$378
- Net cashflow
- $695
Break-even live
Sensitivity live
| Price | -10% $762 | -5% $729 | +0% $695 | +5% $661 | +10% $627 |
|---|---|---|---|---|---|
| Rent | -10% $552 | -5% $623 | +0% $695 | +5% $766 | +10% $837 |
| Rate | -1.0pp $755 | -0.5pp $725 | base $695 | +0.5pp $663 | +1.0pp $632 |
UW: 25.0% down · 7.5% · 30yr · 1.5% tax · 5.0% vac · 8.0% maint · 8.0% mgmt
Financing live
Cash to close
- Down payment
- $30,000
- Closing costs
- $3,600
- Reserves months
- —
- Total cash needed
- —
Loan-product check · same deal, 3 products live
Conventional
25% down · 7.5% · 30yr
- Down + closing
- —
- Monthly P&I
- —
- Monthly cashflow
- —
- DSCR
- —
- Eligible?
- —
Personal DTI + credit; lowest rate.
DSCR
20% down · 8.5% · 30yr
- Down + closing
- —
- Monthly P&I
- —
- Monthly cashflow
- —
- DSCR
- —
- Eligible?
- —
No personal income docs; deal must DSCR.
Hard money
10% down · 12.0% · 12mo
- Down + closing
- —
- Monthly P&I
- —
- Monthly cashflow
- —
- DSCR
- —
- Eligible?
- —
Short-term bridge; refi at stabilization.
Rent comps 1 comps
| Address | Beds | Baths | Sqft | Rent | $/sqft | DOM | Units | Dist |
|---|---|---|---|---|---|---|---|---|
| 29287 Wallace St Gold Beach, OR | 2.0 | 1.5 | 960 | $1,800 | $1.88 | 44d | 1 | 0.74mi |
Listing history 8 events
-
2026-06-21days on market $120,000 Active 10 DOM
-
2026-06-18days on market $120,000 Active 8 DOM
-
2026-06-17days on market $120,000 Active 7 DOM
-
2026-06-16days on market $120,000 Active 6 DOM
-
2026-06-15days on market $120,000 Active 5 DOM
-
2026-06-13days on market $120,000 Active 3 DOM
-
2026-06-12remarks 687-char remark
-
2026-06-12$120,000 Active 2 DOM
ⓘ Source: listings_history table (triggers on properties + properties_extension) + one-shot
backfill from property_details.listing_events for pre-trigger history.
Tax reassessment forecast OR · Resets to sale price
- Current annual tax
- $578 · $48/mo
- Projected year-2 tax
- $1,164 · $97/mo
- Expected delta
- +$586/yr (+$49/mo · 101.4%)
ⓘ Screening estimate from a state-policy table — verify with the county assessor before closing.
Climate risk First Street
- Flood 1/10 Low FEMA zone X (unshaded) · 0% chance over 30 yrs
- Wildfire 3/10 Moderate
- Heat 2/10 Low 8 d/yr ≥81°F today · 24 d/yr by 30 yrs out
- Wind 1/10 Low
- Air quality 7/10 Severe 10 unhealthy d/yr today · 12 by 30 yrs out
Nearby sold comps map
Loading sold comps map…
Walkable amenities ~0.75 mi
Loading nearby amenities…
Taxation est. · year 1
- Rental income
- $21,600
- − Mortgage interest
- −$6,722
- − Property taxes
- −$578
- − Insurance
- −$600
- − Repairs & maintenance
- −$1,728
- − Management
- −$1,728
- − Depreciation
- −$3,491
- Taxable income
- $6,753
- Est. tax owed @ 24.0%
- −$1,621
- After-tax cash flow
- $6,714/yr
For passive investors: Depreciation is non-cash, so a rental often shows a tax loss while cash-flowing — sheltering income. Rental losses are passive: they offset passive income freely, and up to $25,000/yr can offset ordinary (W-2) income if you actively participate and your MAGI is under $100k (phasing out to $0 by $150k); unused losses carry forward. On sale, claimed depreciation is recaptured at up to 25%, and gains may owe capital-gains tax (a 1031 exchange can defer both). Figures are a year-1 estimate at your 24.0% rate — not tax advice; consult a CPA.
Schools (NCES district)
- District
- Central Curry SD 1
- NCES district ID
- 4105760
- Math proficiency
- 42% ▼ -9.00%
- Reading proficiency
- 54% ▼ -4.00%
- Median HH income
- $45,409
- Composite
- 42.76/100
- National rank
- #6773
- State rank
- #53 of 183 in OR
Livability — Gold Beach
- Score
- 70/100
- State rank
- #129
- US rank
- #7452
Category grades
Schools grade is shown separately in the Schools card above.
Census & demographics
- Census place
- Gold Beach, OR
- Population (ZIP)
- 5,794
Population outlook (Curry County) Hauer SSP2
- Today (2025)
- 21,781 people
- By 2030
- 21,121 · -3.0%
- By 2040
- 19,654 · -9.8%
- By 2050
- 18,826 · -13.6%
- By 2075
- 17,968 · -17.5%
- By 2100
- 16,443 · -24.5%
Race, ethnicity, and origin ACS 2023
- Neighborhood character
- Predominantly White (86%)
- Race & ethnicity
- White 86% Two or more races 11% Hispanic / Latino 5%
- Common ancestry
- Italian 9% Slovak 4% Lithuanian 3%
- Foreign-born
- 4% · Canada, Jamaica
- Languages at home
- 95% English-only · Spanish 3% Other Indo-European 1% Russian/Polish/Slavic 1%
Political lean MEDSL · Curry
- 2024 margin
- R (+16.1) · D 40.6% · R 56.7% · Other 2.8%
- 2008→2024 swing
- -4.6pp toward R · 2008: -11.5pp · 2024: -16.1pp
- All cycles
- 2024: R+16.1 2020: R+16.2 2016: R+23.9 2012: R+17.1 2008: R+11.5
Not yet ingested
- Civics
- —
Market trends
- HPI YoY
- ▼ -61.20%
- Current HPI
- 299.7389
- Rent YoY
- —
- Metro
- —
- State GDP YoY
- ▲ 2.05%
- F500 in state
- 2
Industry mix (Fortune 500 HQ in OR)
| Industry | F500 HQs | Revenue |
|---|---|---|
| Consumer Goods | 1 | $51B |
|
||
Price history
+269.2% since first listed10 events — show timeline
- 2026-06-10 Listed $120,000 RMLS
- 2018-01-02 Sold (MLS) $50,000 RMLS
- 2017-11-14 Pending — RMLS
- 2017-11-04 Delisted — RMLS
- 2017-09-15 Price Changed $55,000 RMLS
- 2017-08-06 Listed $59,500 RMLS
- 2017-08-04 Relisted — RMLS
- 2014-07-15 Sold (MLS) $30,000 RMLS
- 2014-06-22 Pending — RMLS
- 2014-04-01 Listed $32,500 RMLS
Property tax history
+5.4%/yrLatest (2025): $578 · +2.8% YoY. Source: county tax records.
Cash-flow waterfall
monthlySold comps — $/sqft
last 12 mo · ≤1 miLoading sold comps…