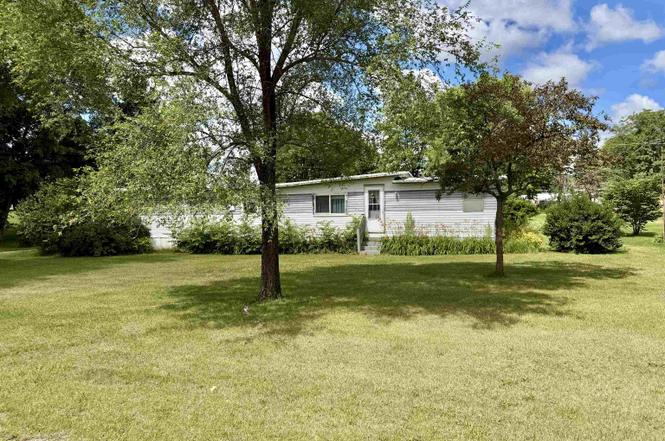
5172 Locust Ln
Thomson, IL 61285
$61,500A-
1 bd · 2.0 ba ·
924 sqft ·
Built 1979
· SingleFamily
· Active
· 3 DOM
Cashflow @ list (25.0% down · 7.5%)
Estimated rent
$860/mo
Mortgage (P&I)
−$323
Tax + insurance
−$102
HOA
−$0
Vac / Maint / Mgmt
−$181
Net cashflow
$254/mo
Annual
$3,051/yr
Cap rate
11.25%
Cash-on-cash
17.72%
DSCR
1.79
1% rule
1.40%
Cash to close
$17,220
Investor read
- This is a 1-bed/2.0-bath single-family listed at $62k.
- At list price, monthly cash flow is $254 ($3k/yr) — positive.
- The deal already cash-flows at list — no discount required.
- Meets the 1% rule at list price ($860 rent vs $62k).
- Only 3 days on market — expect competitive offers; lowballing is unlikely to land.
- In year one you build about $3k of equity ($425 loan paydown + $3k appreciation (4.8% local appreciation)).
- Location reads 61/100 on livability (#927 in IL) — a middle-class / working-renter tenant base. Strengths: cost of living A+, housing A+; Watch: crime C-, amenities F, commute F.
- West Carroll CUSD 314 (rural): math 12% / reading 20% proficiency, ranked #498 of 620 in IL (top 80%) — low school quality limits family demand, transient renter base, plan for 1-2y turnover.
- Zoned schools: West Carroll Primary (math 12% / reading 17%, grade F, #1,278 of 2,056 statewide, top 65%, 416 students, 0% FRL); West Carroll Middle School (math 10% / reading 24%, grade F, #460 of 665 statewide, top 72%, 193 students, 0% FRL); West Carroll High School (math 15% / reading 15%, grade F, #462 of 693 statewide, top 68%, 286 students, 0% FRL) — zoned schools average 0% FRL vs 50% district-wide (50 pts lower); this property's tenant base skews higher-income than the district average.
- Market conditions: 17 active listings in the ZIP; 23 units permitted in Carroll County in 2024 (0 in 5+ unit buildings).
- Carroll County population projected at -30% by 2050 — secular population decline; favor cash flow + early exit over multi-decade hold.
- 2 sale attempts since 23y ago with the ask held roughly flat each time — persistent listings suggest the price (not the market) is what's stuck; bring a comps-based counter.
- Current owner paid $28k; list at $62k implies a 124% gain — meaningful room to come down on a strong offer.
- At projected returns (4.8% appreciation + 3.0% rent growth), your $17k cash investment doubles in ~3 years — after that, you're playing with house money.
- By year 10, paydown + projected appreciation supports a ~$34k cash-out refi (75% LTV) — recoverable capital for the next deal without selling this one.
- Climate carrying-cost: major flood risk — expect insurance premiums to compound above CPI over the hold.
Questions for listing agent
- Built in 1979 — when were the roof, HVAC, electrical panel, plumbing, and water heater last replaced?
- Is there a deadline driving the sale (1031 exchange, divorce, estate, relocation)? That informs how much negotiation room exists.
- Schools are F-rated, which usually means shorter tenancies and higher turnover. Who's the typical renter profile here, and what's been the actual vacancy rate?
- What's the average days-on-market for RENTAL listings here right now (not sales)? A rising rental-DOM trend means longer vacancies and softer asking-rent achievability than the comps imply.
- What's the recent tenant-quality profile in this submarket — average credit score on applications, eviction rate, late-payment / NSF rate, and stable-employment percentage? A property-management company in the area should have these aggregated.
- How much new for-sale + rental construction is in the pipeline within 1–3 miles? Heavy new supply typically softens prices + rents 12–24 months out; constrained supply supports both.
CashFlowRE · CFR-VDRVAX6NA4E2XE
· Data 2 h ago
cashflowre.app · 2026-05-29