5172 Locust Ln · Thomson, IL
Flood risk 6/10 · Moderate
- FEMA flood zone
- X (shaded)
- Chance of flooding over 30 yrs
- 0.74%
- Est. flood insurance / yr
- $507 – $1,088
Fire risk 3/10 · Minor
- Est. fire insurance / yr
- $804 – $1,492
Heat risk 3/10 · Minor
- Hot days now (above 103°F)
- 7 days/yr
- Hot days in 30 yrs
- 16 days/yr
Wind risk 2/10 · Minimal
- Chance of severe wind over 30 yrs
- —
Air-quality risk 3/10 · Minor
- Unhealthy air days now
- 2 days/yr
- Unhealthy air days in 30 yrs
- 3 days/yr
Risk factors via First Street. Map © Google.
Why this score? — see what drove the A- grade
The composite is a weighted blend of 9 inputs, each scored 0–100. Each bar is that input's sub-score; the figure is the points it added to the 100-point composite (weight × sub-score).
- Cash flow +30.0/30.0
- ARV discount +15.0/15.0
- DSCR +10.0/10.0
- 1% rule +9.0/10.0
- Appreciation +7.4/10.0
- Livability +3.1/5.0
- Rent growth +2.5/5.0
- Condition / age +2.5/5.0
- Schools +1.4/10.0
$61,500
🖨 Deal sheet (PDF) 📄 Offer letter ✓ Due diligence
Listing remarks
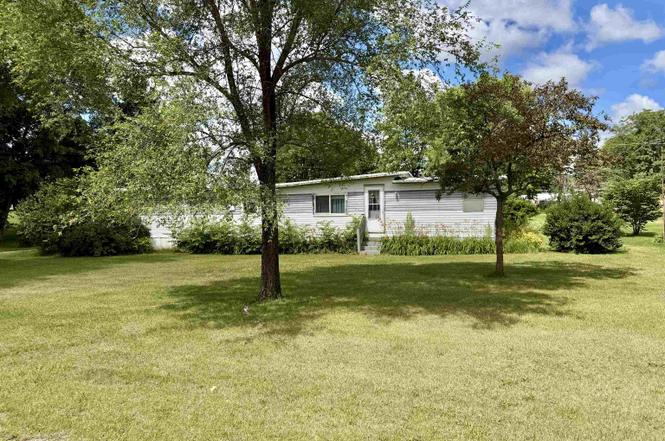
Minutes from the mighty Mississippi River boat docks. 1 bedroom, 2 bath mobile home on a large 1/2-acre lot. 1 car garage, and 2 storage sheds. Great hunter or fishing get away! Above Ground pool and a 12x 12 Covered back deck. note: 2nd bath shower has been capped off. seller has said that the Central air and furnace 2012- Metal roof 2007- water heater 2025- well pump 2026
Key facts
- Metal roof
- Above ground pool
- Large 1/2-acre lot
Tags
Property features AI
Exterior
- Parking: Detached 1-car garage
- Utilities: Private well water; Septic sewer
- Home design: Residential mobile home
- Construction: Metal roof
- Exterior features: Above-ground private pool; 0.53-acre lot
Interior
- Kitchen: Gas cooktop; Microwave; Refrigerator
- Bathrooms: Two full bathrooms (both on the main level)
- Heating & cooling: Forced air heating; Central air conditioning
- Interior features: Gas water heater
- Laundry & utility: Washer; Dryer
Neighborhood map
What this means for you Summary
Snapshot
- This is a 1-bed/2.0-bath single-family listed at $62k.
Deal economics
- At list price, monthly cash flow is $254 ($3k/yr) — positive.
- The deal already cash-flows at list — no discount required.
- Meets the 1% rule at list price ($860 rent vs $62k).
Location & tenants
- Location reads 61/100 on livability (#927 in IL) — a middle-class / working-renter tenant base. Strengths: cost of living A+, housing A+; Watch: crime C-, amenities F, commute F.
- West Carroll CUSD 314 (rural): math 12% / reading 20% proficiency, ranked #498 of 620 in IL (top 80%) — low school quality limits family demand, transient renter base, plan for 1-2y turnover.
- Zoned schools: West Carroll Primary (math 12% / reading 17%, grade F, #1,278 of 2,056 statewide, top 65%, 416 students, 0% FRL); West Carroll Middle School (math 10% / reading 24%, grade F, #460 of 665 statewide, top 72%, 193 students, 0% FRL); West Carroll High School (math 15% / reading 15%, grade F, #462 of 693 statewide, top 68%, 286 students, 0% FRL) — zoned schools average 0% FRL vs 50% district-wide (50 pts lower); this property's tenant base skews higher-income than the district average.
- Market conditions: 17 active listings in the ZIP; 23 units permitted in Carroll County in 2024 (0 in 5+ unit buildings).
Forward outlook
- In year one you build about $3k of equity ($425 loan paydown + $3k appreciation (4.8% local appreciation)).
- Carroll County population projected at -30% by 2050 — secular population decline; favor cash flow + early exit over multi-decade hold.
- At projected returns (4.8% appreciation + 3.0% rent growth), your $17k cash investment doubles in ~3 years — after that, you're playing with house money.
- By year 10, paydown + projected appreciation supports a ~$34k cash-out refi (75% LTV) — recoverable capital for the next deal without selling this one.
Negotiation context
- Only 1 days on market — expect competitive offers; lowballing is unlikely to land.
- 2 sale attempts since 23y ago with the ask held roughly flat each time — persistent listings suggest the price (not the market) is what's stuck; bring a comps-based counter.
- Current owner paid $28k; list at $62k implies a 124% gain — meaningful room to come down on a strong offer.
Risks & watch-outs
- Climate carrying-cost: major flood risk — expect insurance premiums to compound above CPI over the hold.
Questions for the listing agent
- Built in 1979 — when were the roof, HVAC, electrical panel, plumbing, and water heater last replaced?
- Is there a deadline driving the sale (1031 exchange, divorce, estate, relocation)? That informs how much negotiation room exists.
- Schools are F-rated, which usually means shorter tenancies and higher turnover. Who's the typical renter profile here, and what's been the actual vacancy rate?
- What's the average days-on-market for RENTAL listings here right now (not sales)? A rising rental-DOM trend means longer vacancies and softer asking-rent achievability than the comps imply.
- What's the recent tenant-quality profile in this submarket — average credit score on applications, eviction rate, late-payment / NSF rate, and stable-employment percentage? A property-management company in the area should have these aggregated.
- How much new for-sale + rental construction is in the pipeline within 1–3 miles? Heavy new supply typically softens prices + rents 12–24 months out; constrained supply supports both.
Investment metrics
- 1% rule
- 1.40% ✓
- Cap rate
- 11.25%
- Cash-on-cash
- 17.72%
- DSCR
- 1.79
- GRM
- 6.0
CMA / ARV
- ARV (on-the-fly)
- $105,336
- Comps found
- 1
Show comp detail 1 sale within ~0.75 mi
| Address | Dist | Beds/Ba | Sqft | Sold | Price | $/sf | Match |
|---|---|---|---|---|---|---|---|
| 5863 Miner Rd | 0.74mi | 2/1.0 (+1) | 1,056 (+14%) | 0mo | $120,000 | $114 | 32 |
Match score weights: distance 35% · size 25% · config 20% · recency 20%. Top-matched comps best support the ARV.
Projected returns pro-forma
4.84% appreciation · 3.0% rent growth · sell at horizon
- IRR
- 27.9%
- Equity multiple
- 2.73×
- Total profit
- $29,826
- Equity at exit
- $34,261
- IRR
- 26.9%
- Equity multiple
- 5.44×
- Total profit
- $76,468
- Equity at exit
- $58,647
Cash invested: $17,220 (down + closing). Projections, not guarantees.
Landlord ↔ Tenant lean methodology
- Overall (STATE)
- 43 Moderately Tenant-Leaning
- State Illinois
- 43 Moderately Tenant-Leaning · D+7
- County
- — inherits STATE
- City
- — inherits STATE
ZIP-level market 61285
- Home prices YoY
- 2.6%
- Active inventory
- 17
- Price-to-rent
- 6.0×
Monthly cashflow live
- Estimated rent
- $860 medium interval (Pro) →
- Mortgage (P&I)
- −$323
- Tax est. 1.5%
- −$77 /mo · $922/yr
- Insurance
- −$26
- HOA
- −$0
- Vacancy / Maint / Mgmt
- −$181
- Net cashflow
- $254
Break-even live
Sensitivity live
| Price | -10% $297 | -5% $275 | +0% $254 | +5% $233 | +10% $212 |
|---|---|---|---|---|---|
| Rent | -10% $186 | -5% $220 | +0% $254 | +5% $288 | +10% $322 |
| Rate | -1.0pp $285 | -0.5pp $270 | base $254 | +0.5pp $238 | +1.0pp $222 |
UW: 25.0% down · 7.5% · 30yr · 1.5% tax · 5.0% vac · 8.0% maint · 8.0% mgmt
Financing live
Cash to close
- Down payment
- $15,375
- Closing costs
- $1,845
- Reserves months
- —
- Total cash needed
- —
Loan-product check · same deal, 3 products live
Conventional
25% down · 7.5% · 30yr
- Down + closing
- —
- Monthly P&I
- —
- Monthly cashflow
- —
- DSCR
- —
- Eligible?
- —
Personal DTI + credit; lowest rate.
DSCR
20% down · 8.5% · 30yr
- Down + closing
- —
- Monthly P&I
- —
- Monthly cashflow
- —
- DSCR
- —
- Eligible?
- —
No personal income docs; deal must DSCR.
Hard money
10% down · 12.0% · 12mo
- Down + closing
- —
- Monthly P&I
- —
- Monthly cashflow
- —
- DSCR
- —
- Eligible?
- —
Short-term bridge; refi at stabilization.
Listing history 2 events
-
2026-06-19remarks 377-char remark
-
2026-06-19$61,500 Active 1 DOM
ⓘ Source: listings_history table (triggers on properties + properties_extension) + one-shot
backfill from property_details.listing_events for pre-trigger history.
Climate risk First Street
- Flood 6/10 Major FEMA zone X (shaded) · 74% chance over 30 yrs
- Wildfire 3/10 Moderate
- Heat 3/10 Moderate 7 d/yr ≥103°F today · 16 d/yr by 30 yrs out
- Wind 2/10 Low
- Air quality 3/10 Moderate 2 unhealthy d/yr today · 3 by 30 yrs out
Nearby sold comps map
Loading sold comps map…
Walkable amenities ~0.75 mi
Loading nearby amenities…
Taxation est. · year 1
- Rental income
- $10,318
- − Mortgage interest
- −$3,445
- − Property taxes
- −$922
- − Insurance
- −$308
- − Repairs & maintenance
- −$825
- − Management
- −$825
- − Depreciation
- −$1,789
- Taxable income
- $2,203
- Est. tax owed @ 24.0%
- −$529
- After-tax cash flow
- $2,522/yr
For passive investors: Depreciation is non-cash, so a rental often shows a tax loss while cash-flowing — sheltering income. Rental losses are passive: they offset passive income freely, and up to $25,000/yr can offset ordinary (W-2) income if you actively participate and your MAGI is under $100k (phasing out to $0 by $150k); unused losses carry forward. On sale, claimed depreciation is recaptured at up to 25%, and gains may owe capital-gains tax (a 1031 exchange can defer both). Figures are a year-1 estimate at your 24.0% rate — not tax advice; consult a CPA.
Schools (NCES district)
- District
- West Carroll CUSD 314
- NCES district ID
- 1700310
- Math proficiency
- 12% ▼ -5.00%
- Reading proficiency
- 20% ▼ -3.00%
- Median HH income
- $43,090
- Composite
- 13.91/100
- National rank
- #9483
- State rank
- #498 of 620 in IL
Livability — Thomson
- Score
- 61/100
- State rank
- #927
- US rank
- #18008
Category grades
Schools grade is shown separately in the Schools card above.
Census & demographics
- Population (ZIP)
- 2,687
Population outlook (Carroll County) Hauer SSP2
- Today (2025)
- 13,010 people
- By 2030
- 12,150 · -6.6%
- By 2040
- 10,462 · -19.6%
- By 2050
- 9,078 · -30.2%
- By 2075
- 6,704 · -48.5%
- By 2100
- 5,004 · -61.5%
Race, ethnicity, and origin ACS 2023
- Neighborhood character
- Predominantly White (68%)
- Race & ethnicity
- White 68% Black 20% Hispanic / Latino 9% Two or more races 4% Native American 1%
- Hispanic origin (detail)
- Mexican 2%
- Common ancestry
- Iranian 4% Portuguese 2% Slovak 2%
- Foreign-born
- 2% · Canada
- Languages at home
- 93% English-only · Spanish 7%
Political lean MEDSL · Carroll
- 2024 margin
- Solid R (+31.7) · D 33.2% · R 64.8% · Other 2.0%
- 2008→2024 swing
- -36.5pp toward R · 2008: 4.8pp · 2024: -31.7pp
- All cycles
- 2024: R+31.7 2020: R+29.4 2016: R+27.1 2012: D+1.4 2008: D+4.8
Not yet ingested
- Civics
- —
Market trends
- HPI YoY
- ▲ 4.84%
- Current HPI
- 190.7445
- Rent YoY
- —
- Metro
- —
- State GDP YoY
- ▲ 1.59%
- F500 in state
- 60
Industry mix (Fortune 500 HQ in IL)
| Industry | F500 HQs | Revenue |
|---|---|---|
| Insurance | 4 | $201B |
|
||
| Consumer Goods | 4 | $87B |
|
||
| Industrial Machinery | 3 | $64B |
|
||
| Healthcare | 2 | $55B |
|
||
| Retail / Pharmacy | 1 | $148B |
|
||
| Agriculture / Food | 1 | $86B |
|
||
Price history
+54.1% since first listed4 events — show timeline
- 2026-06-18 Listed $61,500 NWIAR
- 2004-03-26 Sold (Public Records) $28,500 Public Records
- 2004-03-26 Sold (MLS) $27,500 RMLSA as Distributed by MLS Grid
- 2003-11-10 Listed $39,900 RMLSA as Distributed by MLS Grid
Property tax history
+14.3%/yrLatest (2023): $102 · +277.0% YoY. Source: county tax records.
Cash-flow waterfall
monthlySold comps — $/sqft
last 12 mo · ≤1 miLoading sold comps…