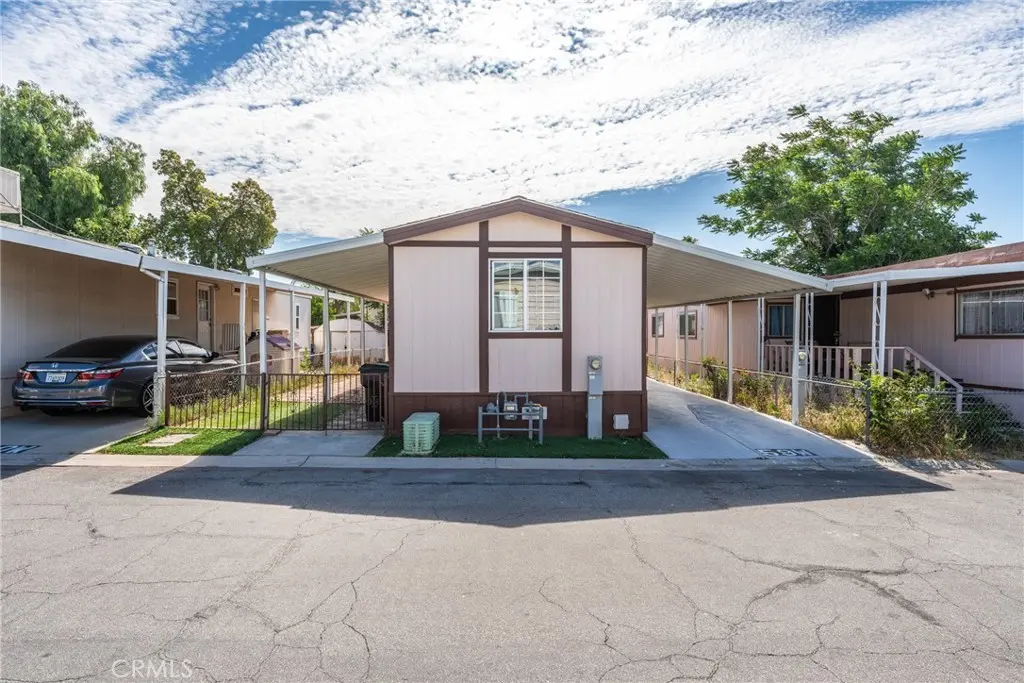
17225 Valley
Fontana, CA 92335
$100,000C+
2 bd · 2.0 ba ·
720 sqft ·
Built 1990
· Manufactured
· Active
· 167 DOM
Cashflow @ list (25.0% down · 7.5%)
Estimated rent
$1,934/mo
Mortgage (P&I)
−$524
Tax + insurance
−$167
HOA
−$0
Vac / Maint / Mgmt
−$406
Net cashflow
$837/mo
Annual
$10,044/yr
Cap rate
16.34%
Cash-on-cash
35.87%
DSCR
2.60
1% rule
1.93%
Cash to close
$28,000
Investor read
- This is a 2-bed/2.0-bath manufactured listed at $100k. Condition is rated good.
- At list price, monthly cash flow is $837 ($10k/yr) — positive.
- The deal already cash-flows at list — no discount required.
- Meets the 1% rule at list price ($2k rent vs $100k).
- It's been on market 167 days — a 12% lower offer ($88k) is reasonable based on typical stale-listing flexibility.
- Recommended offer: $88k (12.0% below list) — sets the bar for market timing.
- Local home prices are declining (-3.0%/yr); year-one equity from $691 of loan paydown is wiped out by about $3k of value loss. Plan a longer hold.
- Location reads 64/100 on livability (#415 in CA) — a middle-class / working-renter tenant base. Strengths: housing A+, commute A-, employment A-; Watch: schools F, amenities F, cost of living F.
- Colton Joint Unified (suburban): math 16% / reading 38% proficiency, ranked #373 of 517 in CA (top 72%) — low school quality limits family demand, transient renter base, plan for 1-2y turnover; 70% free/reduced lunch — lower-income household profile, screen leases tightly.
- Market conditions: Rents rising (+2.3%/yr); 115 active listings in the ZIP; 3 comparable units currently listed for rent nearby; rentals lingering (median 44d on market — plan ~5-8 weeks vacancy on turnover, expect pricing pressure); 67% of comp listings sitting > 30 days — soft ceiling on asking rent; solid renter incomes; 5,458 units permitted in San Bernardino County in 2024 (1,500 in 5+ unit buildings).
- San Bernardino County population projected at +15% by 2050 — modest demand growth; plan on rents tracking national, not racing it.
- At projected returns (-3.0% appreciation + 2.3% rent growth), your $28k cash investment doubles in ~4 years — after that, you're playing with house money.
- Cap rate 16.3% vs local median 3.2% in Fontana — top-decile yield for the area; either an underpriced asset or a hidden risk that comps aren't pricing in. Stress-test before assuming the spread holds.
Questions for listing agent
- It's been on market 167 days. Have you received any prior offers? Is the seller open to a 12% concession, seller financing, or rate buy-down credit?
- Why hasn't it sold? Are there any deal-killer items the seller is aware of (foundation, flood, title, zoning, code violations)?
- Is there a deadline driving the sale (1031 exchange, divorce, estate, relocation)? That informs how much negotiation room exists.
- Schools are F-rated, which usually means shorter tenancies and higher turnover. Who's the typical renter profile here, and what's been the actual vacancy rate?
- What's the average days-on-market for RENTAL listings here right now (not sales)? A rising rental-DOM trend means longer vacancies and softer asking-rent achievability than the comps imply.
- What's the recent tenant-quality profile in this submarket — average credit score on applications, eviction rate, late-payment / NSF rate, and stable-employment percentage? A property-management company in the area should have these aggregated.
- How much new for-sale + rental construction is in the pipeline within 1–3 miles? Heavy new supply typically softens prices + rents 12–24 months out; constrained supply supports both.
Repairs flagged (vision-AI assessment)
- Moderate: kitchen cabinets — dated and in need of replacement
- Moderate: bathroom fixtures — dated and in need of replacement
- Moderate: exterior siding — moderate wear and tear
CashFlowRE · CFR-VG0Q99A0ZZAYAV
· Data 2 days ago
cashflowre.app · 2026-05-29