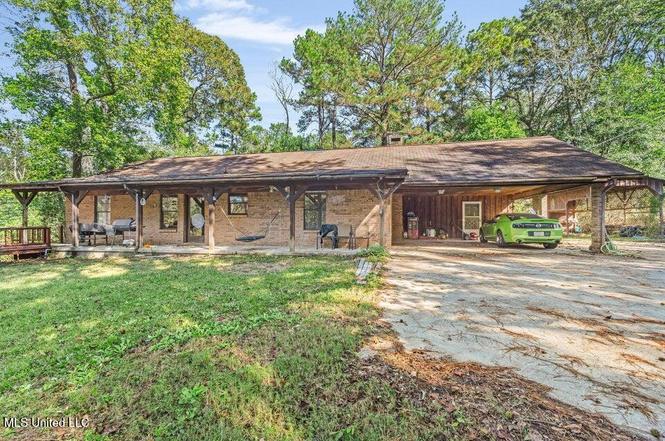
542 Southgate Rd
Hattiesburg, MS 39401
$142,500D
2 bd · 1.0 ba ·
1,488 sqft ·
Built 1986
· SingleFamily
· Active
· 197 DOM
Cashflow @ list (25.0% down · 7.5%)
Estimated rent
$1,197/mo
Mortgage (P&I)
−$747
Tax + insurance
−$208
HOA
−$0
Vac / Maint / Mgmt
−$251
Net cashflow
$-10/mo
Annual
$-124/yr
Cap rate
6.21%
Cash-on-cash
-0.31%
DSCR
0.99
1% rule
0.84%
Cash to close
$39,900
Investor read
- This is a 2-bed/1.0-bath single-family listed at $142k.
- At list price, monthly cash flow is $-10 ($-124/yr) — negative.
- To cash-flow at today's rent, offer at most $141k (1.3% below list).
- To meet the 1% rule (rent ≥ 1% of price), the offer needs to be $120k (16.0% below list).
- It's been on market 197 days — a 12% lower offer ($125k) is reasonable based on typical stale-listing flexibility.
- Recommended offer: $120k (16.0% below list) — sets the bar for 1% rule.
- Local home prices are declining (-3.0%/yr); year-one equity from $985 of loan paydown is wiped out by about $4k of value loss. Plan a longer hold.
- Location reads 79/100 on livability (#5 in MS, #2,046 nationally) — a middle-class / working-renter tenant base. Strengths: commute A+, cost of living A+, health & safety A+; Watch: schools D+, crime D+, employment F.
- Forrest County School District (rural): math 39% / reading 36% proficiency, ranked #47 of 130 in MS (top 36%) — families likely to look elsewhere, expect single-tenant / working-renter base with shorter leases; 67% free/reduced lunch — lower-income household profile, screen leases tightly.
- Market conditions: Rents rising fast (+6.6%/yr); 261 active listings in the ZIP; lower-income renter base — watch delinquency; 121 units permitted in Forrest County in 2024 (30 in 5+ unit buildings).
- Forrest County population projected at +6% by 2050 — modest demand growth; plan on rents tracking national, not racing it.
- 8 sale attempts since 5y ago with the ask held roughly flat each time — persistent listings suggest the price (not the market) is what's stuck; bring a comps-based counter.
- Climate carrying-cost: severe wind risk, 99% chance of damaging wind over 30y; major wildfire risk; extreme-heat days projected 7→20/yr by 2055 (HVAC capex compounding) — expect insurance premiums to compound above CPI over the hold.
- Cap rate 6.2% vs local median 4.0% in Hattiesburg — top-decile yield for the area; either an underpriced asset or a hidden risk that comps aren't pricing in. Stress-test before assuming the spread holds.
- This rent runs 35% of the median local income ($41k/yr) — at the standard rent-burdened threshold; future hikes will face affordability resistance.
Questions for listing agent
- What do current leases actually rent for vs. the listed asking? Can we see a recent rent roll and the last 12 months of T-12 income?
- It's been on market 197 days. Have you received any prior offers? Is the seller open to a 16% concession, seller financing, or rate buy-down credit?
- Why hasn't it sold? Are there any deal-killer items the seller is aware of (foundation, flood, title, zoning, code violations)?
- Is there a deadline driving the sale (1031 exchange, divorce, estate, relocation)? That informs how much negotiation room exists.
- Schools are D-rated, which usually means shorter tenancies and higher turnover. Who's the typical renter profile here, and what's been the actual vacancy rate?
- Crime grade is D in this area — have there been break-ins, vandalism, or insurance claims at this property in the last 3 years? What carrier currently insures it and at what premium?
- The area grade is low — what's the realistic commute time and amenity access for the typical tenant pool here? Any planned neighborhood developments (good or bad) we should know about?
- What's the average days-on-market for RENTAL listings here right now (not sales)? A rising rental-DOM trend means longer vacancies and softer asking-rent achievability than the comps imply.
CashFlowRE · CFR-VG2CC143D8PVXC
· Data 1 day ago
cashflowre.app · 2026-05-29