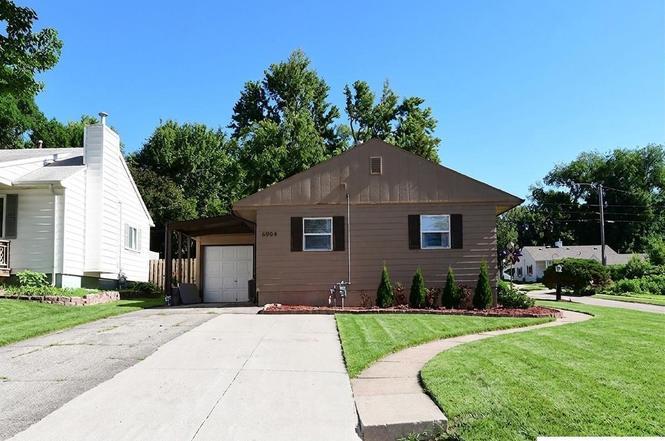
6904 Lafayette Ave
Omaha, NE 68132
$169,900D
3 bd · 1.0 ba ·
960 sqft ·
Built 1953
· SingleFamily
· Active
· 9 DOM
Cashflow @ list (25.0% down · 7.5%)
Estimated rent
$1,432/mo
Mortgage (P&I)
−$891
Tax + insurance
−$298
HOA
−$0
Vac / Maint / Mgmt
−$301
Net cashflow
$-57/mo
Annual
$-684/yr
Cap rate
5.89%
Cash-on-cash
-1.44%
DSCR
0.94
1% rule
0.84%
Cash to close
$47,572
Investor read
- This is a 3-bed/1.0-bath single-family listed at $170k.
- At list price, monthly cash flow is $-57 ($-684/yr) — negative.
- To cash-flow at today's rent, offer at most $160k (5.9% below list).
- To meet the 1% rule (rent ≥ 1% of price), the offer needs to be $143k (15.7% below list).
- Only 9 days on market — expect competitive offers; lowballing is unlikely to land.
- Recommended offer: $143k (15.7% below list) — sets the bar for 1% rule.
- Local home prices are declining (-3.0%/yr); year-one equity from $1k of loan paydown is wiped out by about $5k of value loss. Plan a longer hold.
- Location reads 84/100 on livability (#7 in NE, #663 nationally) — a professional / high-income tenant draw. Strengths: amenities A+, commute A+, cost of living A+; Watch: crime F.
- Westside Community Schools (urban): math 51% / reading 56% proficiency, ranked #45 of 111 in NE (top 40%) — acceptable for families but not a draw, mixed tenant base, ~2y average lease.
- Zoned schools: Hillside Elementary School (math 36% / reading 47%, grade F, #342 of 502 statewide, top 68%, 372 students, 43% FRL); Westside Middle School (math 58% / reading 54%, grade B-, #28 of 128 statewide, top 22%, 979 students, 39% FRL); Westside High School (math 49% / reading 55%, grade D+, #98 of 261 statewide, top 40%, 2,106 students, 33% FRL).
- Watch-outs: built in 1953 — expect roof / HVAC / electrical / plumbing capex.
- Market conditions: Rents rising fast (+8.9%/yr); 86 active listings in the ZIP; 25 comparable units currently listed for rent nearby; rentals at typical pace (median 21d on market — plan ~3-4 weeks tenant-placement turnaround); 4,539 units permitted in Douglas County in 2024 (2,583 in 5+ unit buildings).
- Douglas County population projected at +28% by 2050 — long-run rental-demand tailwind backs the buy-and-hold thesis.
- 5 sale attempts since 23y ago with the ask held roughly flat each time — persistent listings suggest the price (not the market) is what's stuck; bring a comps-based counter.
- Cap rate 5.9% vs local median 3.6% in Omaha — top-decile yield for the area; either an underpriced asset or a hidden risk that comps aren't pricing in. Stress-test before assuming the spread holds.
Questions for listing agent
- What do current leases actually rent for vs. the listed asking? Can we see a recent rent roll and the last 12 months of T-12 income?
- Built in 1953 — when were the roof, HVAC, electrical panel, plumbing, and water heater last replaced?
- Is there a deadline driving the sale (1031 exchange, divorce, estate, relocation)? That informs how much negotiation room exists.
- Crime grade is F in this area — have there been break-ins, vandalism, or insurance claims at this property in the last 3 years? What carrier currently insures it and at what premium?
- The area grade is low — what's the realistic commute time and amenity access for the typical tenant pool here? Any planned neighborhood developments (good or bad) we should know about?
- What's the average days-on-market for RENTAL listings here right now (not sales)? A rising rental-DOM trend means longer vacancies and softer asking-rent achievability than the comps imply.
- What's the recent tenant-quality profile in this submarket — average credit score on applications, eviction rate, late-payment / NSF rate, and stable-employment percentage? A property-management company in the area should have these aggregated.
- How much new for-sale + rental construction is in the pipeline within 1–3 miles? Heavy new supply typically softens prices + rents 12–24 months out; constrained supply supports both.
CashFlowRE · CFR-VGBZ0W6BYE9T2T
· Data 15 h ago
cashflowre.app · 2026-05-29