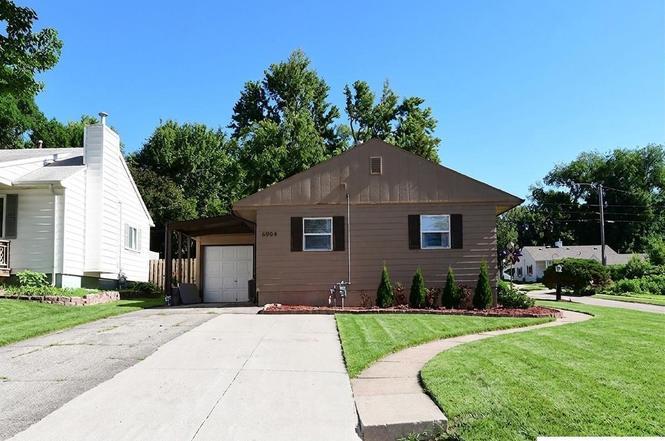
6904 Lafayette Ave · Omaha, NE
Flood risk 1/10 · Minimal
- FEMA flood zone
- X (unshaded)
- Chance of flooding over 30 yrs
- 0.0%
- Est. flood insurance / yr
- $507 – $1,088
Fire risk 1/10 · Minimal
- Est. fire insurance / yr
- $1,161 – $2,155
Heat risk 3/10 · Minor
- Hot days now (above 104°F)
- 7 days/yr
- Hot days in 30 yrs
- 15 days/yr
Wind risk 2/10 · Minimal
- Chance of severe wind over 30 yrs
- —
Air-quality risk 2/10 · Minimal
- Unhealthy air days now
- 0 days/yr
- Unhealthy air days in 30 yrs
- 1 days/yr
Risk factors via First Street. Map © Google.
Why this score? — see what drove the D grade
The composite is a weighted blend of 9 inputs, each scored 0–100. Each bar is that input's sub-score; the figure is the points it added to the 100-point composite (weight × sub-score).
- Cash flow +11.5/30.0
- ARV discount +8.0/15.0
- Rent growth +4.7/5.0
- Schools +4.7/10.0
- Livability +4.2/5.0
- 1% rule +3.4/10.0
- DSCR +3.4/10.0
- Condition / age +2.5/5.0
- Appreciation +0.0/10.0
$169,900
🖨 Deal sheet (PDF) 📄 Offer letter ✓ Due diligence
Listing remarks MLS
Opportunity knocks with this 3 bedroom ranch! Perfect for a first time homebuyer or investment property! This home offers a huge lot, spacious living room, abundant kitchen cabinets, newer carpet and vinyl windows! The seller added a new additional driveway for extra off-street parking, and there is a workshop behind with amazing space to pursue your hobbies! You can’t beat the location – close to Methodist, The Med Center, UNO, and is in the Westside/District 66 school district! AMA
Key facts
- Move-in ready
- New a/c system
- Corner lot
Tags
Property features AI
Exterior
- Parking: Attached covered garage (1 car)
- Utilities: Public water; Public sewer; Electricity available; Natural gas available; Cable available; Storm sewer
- Home design: Single-family residence; Residential property; Not new (built in 1953)
- Construction: Wood siding exterior; Composition roof; Slab foundation; Built in 1953
- Exterior features: Deck; Corner lot; Curb and gutter; Sloped lot; Wooded lot
Interior
- Kitchen: Range; Refrigerator; Dishwasher; Microwave; Laminate flooring in the kitchen
- Bedrooms: Primary bedroom on the main floor with luxury vinyl plank flooring and ceiling fan; Two additional main-floor bedrooms with luxury vinyl plank flooring and ceiling fans
- Flooring: Luxury vinyl plank; Vinyl
- Bathrooms: One full bathroom on the main floor
- Heating & cooling: Natural gas forced-air heating; Central air conditioning
- Interior features: Ceiling fans in living areas and bedrooms; No fireplace; Washer and dryer included; Microwave included
- Laundry & utility: Washer and dryer included
Neighborhood map
What this means for you Summary
Snapshot
- This is a 3-bed/1.0-bath single-family listed at $170k.
Deal economics
- At list price, monthly cash flow is $-57 ($-684/yr) — negative.
- To cash-flow at today's rent, offer at most $160k (5.9% below list).
- To meet the 1% rule (rent ≥ 1% of price), the offer needs to be $143k (15.7% below list).
- Recommended offer: $143k (15.7% below list) — sets the bar for 1% rule.
- Cap rate 5.9% vs local median 3.6% in Omaha — top-decile yield for the area; either an underpriced asset or a hidden risk that comps aren't pricing in. Stress-test before assuming the spread holds.
Location & tenants
- Location reads 84/100 on livability (#7 in NE, #663 nationally) — a professional / high-income tenant draw. Strengths: amenities A+, commute A+, cost of living A+; Watch: crime F.
- Westside Community Schools (urban): math 51% / reading 56% proficiency, ranked #45 of 111 in NE (top 40%) — acceptable for families but not a draw, mixed tenant base, ~2y average lease.
- Zoned schools: Hillside Elementary School (math 36% / reading 47%, grade F, #342 of 502 statewide, top 68%, 372 students, 43% FRL); Westside Middle School (math 58% / reading 54%, grade B-, #28 of 128 statewide, top 22%, 979 students, 39% FRL); Westside High School (math 49% / reading 55%, grade D+, #98 of 261 statewide, top 40%, 2,106 students, 33% FRL).
- Market conditions: Rents rising fast (+8.9%/yr); 86 active listings in the ZIP; 25 comparable units currently listed for rent nearby; rentals at typical pace (median 21d on market — plan ~3-4 weeks tenant-placement turnaround); 4,539 units permitted in Douglas County in 2024 (2,583 in 5+ unit buildings).
Forward outlook
- Local home prices are declining (-3.0%/yr); year-one equity from $1k of loan paydown is wiped out by about $5k of value loss. Plan a longer hold.
- Douglas County population projected at +28% by 2050 — long-run rental-demand tailwind backs the buy-and-hold thesis.
Negotiation context
- Only 9 days on market — expect competitive offers; lowballing is unlikely to land.
- 5 sale attempts since 23y ago with the ask held roughly flat each time — persistent listings suggest the price (not the market) is what's stuck; bring a comps-based counter.
Risks & watch-outs
- Watch-outs: built in 1953 — expect roof / HVAC / electrical / plumbing capex.
Questions for the listing agent
- What do current leases actually rent for vs. the listed asking? Can we see a recent rent roll and the last 12 months of T-12 income?
- Built in 1953 — when were the roof, HVAC, electrical panel, plumbing, and water heater last replaced?
- Is there a deadline driving the sale (1031 exchange, divorce, estate, relocation)? That informs how much negotiation room exists.
- Crime grade is F in this area — have there been break-ins, vandalism, or insurance claims at this property in the last 3 years? What carrier currently insures it and at what premium?
- The area grade is low — what's the realistic commute time and amenity access for the typical tenant pool here? Any planned neighborhood developments (good or bad) we should know about?
- What's the average days-on-market for RENTAL listings here right now (not sales)? A rising rental-DOM trend means longer vacancies and softer asking-rent achievability than the comps imply.
- What's the recent tenant-quality profile in this submarket — average credit score on applications, eviction rate, late-payment / NSF rate, and stable-employment percentage? A property-management company in the area should have these aggregated.
- How much new for-sale + rental construction is in the pipeline within 1–3 miles? Heavy new supply typically softens prices + rents 12–24 months out; constrained supply supports both.
Investment metrics
- 1% rule
- 0.84% ✗
- Cap rate
- 5.89%
- Cash-on-cash
- -1.44%
- DSCR
- 0.94
- GRM
- 9.9
CMA / ARV
- ARV (on-the-fly)
- $171,840
- Comps found
- 12
Show comp detail 12 sales within ~0.75 mi
| Address | Dist | Beds/Ba | Sqft | Sold | Price | $/sf | Match |
|---|---|---|---|---|---|---|---|
| 1514 N 70 Ave | 0.20mi | 3/1.0 | 960 (0%) | 1mo | $153,000 | $159 | 90 |
| 6911 Lafayette Ave | 0.04mi | 3/1.0 | 864 (-10%) | 4mo | $185,000 | $214 | 78 |
| 6638 Decatur St | 0.38mi | 3/1.0 | 960 (0%) | 5mo | $160,000 | $167 | 78 |
| 6643 Hamilton St | 0.16mi | 3/2.0 | 928 (-3%) | 10mo | $182,500 | $197 | 75 |
| 6632 Franklin St | 0.31mi | 3/1.0 | 908 (-5%) | 10mo | $162,000 | $178 | 68 |
| 6615 Charles St | 0.24mi | 2/1.0 (-1) | 864 (-10%) | 4mo | $168,900 | $195 | 64 |
| 2030 N 68th St | 0.50mi | 2/1.0 (-1) | 952 (-1%) | 9mo | $170,000 | $179 | 63 |
| 6658 Decatur St | 0.38mi | 2/1.0 (-1) | 903 (-6%) | 6mo | $178,000 | $197 | 62 |
| 6615 Seward St | 0.27mi | 3/1.0 | 1,104 (+15%) | 1mo | $194,000 | $176 | 61 |
| 2316 N 69th St | 0.58mi | 2/2.0 (-1) | 1,018 (+6%) | 7mo | $200,000 | $196 | 48 |
| 6123 Seward St | 0.60mi | 3/1.0 | 1,080 (+12%) | 8mo | $163,000 | $151 | 44 |
| 2302 N 64th St | 0.70mi | 2/2.0 (-1) | 1,088 (+13%) | 2mo | $127,500 | $117 | 35 |
Match score weights: distance 35% · size 25% · config 20% · recency 20%. Top-matched comps best support the ARV.
Projected returns pro-forma
-3.0% appreciation · 8.0% rent growth · sell at horizon
- IRR
- -13.1%
- Equity multiple
- 0.50×
- Total profit
- $-23,562
- Equity at exit
- $25,333
- IRR
- 2.3%
- Equity multiple
- 1.20×
- Total profit
- $9,385
- Equity at exit
- $14,690
Cash invested: $47,572 (down + closing). Projections, not guarantees.
Landlord ↔ Tenant lean methodology
- Overall (STATE)
- 83 Strongly Landlord-Friendly
- State Nebraska
- 83 Strongly Landlord-Friendly · R+13
- County
- — inherits STATE
- City
- — inherits STATE
ZIP-level market 68132
- Rents YoY
- 8.9%
- Active inventory
- 86
- Price-to-rent
- 9.9×
Monthly cashflow live
- Estimated rent
- $1,432 high interval (Pro) →
- Mortgage (P&I)
- −$891
- Tax from tax record
- −$227 /mo · $2,723/yr
- Insurance
- −$71
- HOA
- −$0
- Vacancy / Maint / Mgmt
- −$301
- Net cashflow
- $-57
Break-even live
Sensitivity live
| Price | -10% $39 | -5% $-9 | +0% $-57 | +5% $-105 | +10% $-153 |
|---|---|---|---|---|---|
| Rent | -10% $-170 | -5% $-114 | +0% $-57 | +5% $0 | +10% $56 |
| Rate | -1.0pp $29 | -0.5pp $-14 | base $-57 | +0.5pp $-101 | +1.0pp $-146 |
UW: 25.0% down · 7.5% · 30yr · 1.5% tax · 5.0% vac · 8.0% maint · 8.0% mgmt
Financing live
Cash to close
- Down payment
- $42,475
- Closing costs
- $5,097
- Reserves months
- —
- Total cash needed
- —
Loan-product check · same deal, 3 products live
Conventional
25% down · 7.5% · 30yr
- Down + closing
- —
- Monthly P&I
- —
- Monthly cashflow
- —
- DSCR
- —
- Eligible?
- —
Personal DTI + credit; lowest rate.
DSCR
20% down · 8.5% · 30yr
- Down + closing
- —
- Monthly P&I
- —
- Monthly cashflow
- —
- DSCR
- —
- Eligible?
- —
No personal income docs; deal must DSCR.
Hard money
10% down · 12.0% · 12mo
- Down + closing
- —
- Monthly P&I
- —
- Monthly cashflow
- —
- DSCR
- —
- Eligible?
- —
Short-term bridge; refi at stabilization.
Rent comps 25 comps
| Address | Beds | Baths | Sqft | Rent | $/sqft | DOM | Units | Dist |
|---|---|---|---|---|---|---|---|---|
| 7303 Decatur St Unit 7303/04 Omaha, NE | 2.0 | 1.0 | 850 | $925 | $1.09 | 5d | 1 | 0.44mi |
| 6241 Decatur St Omaha, NE | 3.0 | 1.0 | 866 | $1,595 | $1.84 | 12d | 1 | 0.57mi |
| 7402 Blondo St Omaha, NE | 2.0 | 1.0 | 1000 | $895 | $0.90 | 45d | 1 | 0.61mi |
| 7349 Grant St Omaha, NE | 1.0–2.0 | 1.0–2.0 | 967 | $1,350 | $1.40 | 4d | 6 | 0.62mi |
| 2316 N 65th Ave Omaha, NE | 2.0 | 1.5 | 884 | $1,500 | $1.70 | 23d | 1 | 0.63mi |
| 6066 Charles St Omaha, NE | 2.0 | 1.0 | 910 | $1,700 | $1.87 | 21d | 1 | 0.65mi |
| 1210 N 60th St Unit 4 Omaha, NE | 2.0 | 1.0 | 900 | $1,400 | $1.56 | 45d | 1 | 0.72mi |
| 7602 Parker St Omaha, NE | 3.0 | 2.0 | 1040 | $1,695 | $1.63 | 5d | 1 | 0.73mi |
| 7602 Parker St Omaha, NE | 3.0 | 2.0 | 1050 | $1,700 | $1.62 | 45d | 1 | 0.73mi |
| 6990 Dodge St Omaha, NE | 2.0 | 1.0–2.0 | 947 | $1,495 | $1.58 | 5d | 3 | 0.75mi |
| 5833 Lafayette Ave Unit 5833 Omaha, NE | 2.0 | 1.0 | 900 | $1,295 | $1.44 | 25d | 1 | 0.77mi |
| 7610 Ohio Plz Omaha, NE | 2.0 | 1.0–1.5 | 1050 | $1,138 | $1.08 | 45d | 1 | 0.94mi |
| 7079 Binney St Omaha, NE | 2.0 | 1.0 | 840 | $1,500 | $1.79 | 25d | 1 | 0.97mi |
| 2303 Benson Gardens Blvd Omaha, NE | 2.0 | 1.0–2.0 | 800 | $1,275 | $1.59 | 4d | 14 | 0.98mi |
| 6704 Binney St Unit 67045 Omaha, NE | 2.0 | 1.0 | 800 | $850 | $1.06 | 16d | 1 | 0.98mi |
| 6539 Binney St Omaha, NE | 2.0 | 1.0 | 720 | $1,300 | $1.81 | 25d | 1 | 0.98mi |
| 7316 Maple St Omaha, NE | 1.0–2.0 | 1.0 | 850 | $1,095 | $1.29 | 45d | 10 | 1.00mi |
| 7311 Wirt Cir Omaha, NE | 1.0–2.0 | 1.0 | 850 | $1,045 | $1.23 | 25d | 11 | 1.05mi |
| 6152 Military Ave Omaha, NE | 2.0 | 1.0–2.0 | 785 | $1,599 | $2.04 | 4d | 6 | 1.13mi |
| 1920 Robertson Dr Omaha, NE | 2.0 | 1.0 | 1100 | $1,038 | $0.94 | 45d | 5 | 1.14mi |
| 670 S 69th St Omaha, NE | 3.0 | 1.0 | 1014 | $1,650 | $1.63 | 4d | 1 | 1.26mi |
| 8004 Farnam Dr Omaha, NE | 2.0 | 1.0–2.0 | 860 | $2,647 | $3.08 | 5d | 24 | 1.33mi |
| 3333 N 61st St Unit 3331 Omaha, NE | 2.0 | 1.0 | 1077 | $1,050 | $0.97 | 13d | 1 | 1.38mi |
| 7520 Howard St Omaha, NE | 1.0–2.0 | 1.0 | 750 | $1,125 | $1.50 | 21d | 11 | 1.45mi |
| 6020 Birch St Unit 6 Omaha, NE | 2.0 | 1.0 | 800 | $1,150 | $1.44 | 45d | 1 | 1.47mi |
Listing history 7 events
-
2026-06-22days on market $169,900 Active 9 DOM
-
2026-06-18days on market $169,900 Active 6 DOM
-
2026-06-17statusdays on market $169,900 Active 5 DOM
-
2026-06-16days on market $169,900 New 4 DOM
-
2026-06-15days on market $169,900 New 3 DOM
-
2026-06-13remarks 572-char remark
-
2026-06-13$169,900 New 1 DOM
ⓘ Source: listings_history table (triggers on properties + properties_extension) + one-shot
backfill from property_details.listing_events for pre-trigger history.
Tax reassessment forecast NE · Resets to sale price
- Current annual tax
- $2,723 · $227/mo
- Projected year-2 tax
- $2,939 · $245/mo
- Expected delta
- +$216/yr (+$18/mo · 7.9%)
ⓘ Screening estimate from a state-policy table — verify with the county assessor before closing.
Climate risk First Street
- Flood 1/10 Low FEMA zone X (unshaded) · 0% chance over 30 yrs
- Wildfire 1/10 Low
- Heat 3/10 Moderate 7 d/yr ≥104°F today · 15 d/yr by 30 yrs out
- Wind 2/10 Low
- Air quality 2/10 Low 0 unhealthy d/yr today · 1 by 30 yrs out
Nearby sold comps map
Loading sold comps map…
Walkable amenities ~0.75 mi
Loading nearby amenities…
Taxation est. · year 1
- Rental income
- $17,190
- − Mortgage interest
- −$9,517
- − Property taxes
- −$2,723
- − Insurance
- −$850
- − Repairs & maintenance
- −$1,375
- − Management
- −$1,375
- − Depreciation
- −$4,943
- Taxable loss
- −$3,593
- Est. tax savings @ 24.0%
- +$862
- After-tax cash flow
- $178/yr
For passive investors: Depreciation is non-cash, so a rental often shows a tax loss while cash-flowing — sheltering income. Rental losses are passive: they offset passive income freely, and up to $25,000/yr can offset ordinary (W-2) income if you actively participate and your MAGI is under $100k (phasing out to $0 by $150k); unused losses carry forward. On sale, claimed depreciation is recaptured at up to 25%, and gains may owe capital-gains tax (a 1031 exchange can defer both). Figures are a year-1 estimate at your 24.0% rate — not tax advice; consult a CPA.
Schools (NCES district)
- District
- Westside Community Schools
- NCES district ID
- 3178660
- Math proficiency
- 51% ▼ -8.00%
- Reading proficiency
- 56% ▼ -4.00%
- Median HH income
- $58,995
- Composite
- 46.53/100
- National rank
- #2429
- State rank
- #45 of 111 in NE
Livability — Omaha
- Score
- 84/100
- State rank
- #7
- US rank
- #663
Category grades
Schools grade is shown separately in the Schools card above.
Census & demographics
- Census place
- Omaha, NE
- County
- Douglas County · 538,646 people
- City population
- 552,986
- Metro
- Omaha-Council Bluffs, NE-IA
- Population (ZIP)
- 13,960
- Household income
- $68,221
- Rent vs Own
- Severe rent burden
- 540.0
Population outlook (Douglas County) Hauer SSP2
- Today (2025)
- 625,245 people
- By 2030
- 661,613 · +5.8%
- By 2040
- 732,395 · +17.1%
- By 2050
- 801,988 · +28.3%
- By 2075
- 968,637 · +54.9%
- By 2100
- 1,101,871 · +76.2%
Race, ethnicity, and origin ACS 2023
- Neighborhood character
- Predominantly White (75%)
- Race & ethnicity
- White 75% Hispanic / Latino 11% Black 7% Asian 3% Two or more races 3%
- Hispanic origin (detail)
- Mexican 9%
- Common ancestry
- Lithuanian 4% Romanian 2% Slovak 2%
- Foreign-born
- 9% · United Kingdom, Canada, Philippines
- Languages at home
- 85% English-only · Spanish 8% French/Haitian/Cajun 3% Other Indo-European 1%
Political lean MEDSL · Douglas
- 2024 margin
- D (+10.2) · D 54.4% · R 44.2% · Other 1.4%
- 2008→2024 swing
- +5.5pp toward D · 2008: 4.6pp · 2024: 10.2pp
- All cycles
- 2024: D+10.2 2020: D+11.3 2016: D+1.4 2012: R+4.3 2008: D+4.6
Not yet ingested
- Civics
- —
Market trends
- HPI YoY
- ▼ -388.04%
- Current HPI
- 236.9179
- Rent YoY
- ▲ 8.88%
- Metro
- Omaha-Council Bluffs, NE-IA
- State GDP YoY
- ▲ 0.68%
- F500 in state
- 2
Industry mix (Fortune 500 HQ in NE)
| Industry | F500 HQs | Revenue |
|---|---|---|
| Conglomerate | 1 | $371B |
|
||
Price history
+422.8% since first listed17 events — show timeline
- 2026-06-12 Listed $169,900 GPRMLS
- 2023-08-09 Sold (Public Records) $160,000 Public Records
- 2023-08-01 Sold (MLS) $160,000 GPRMLS
- 2023-07-09 Pending — GPRMLS
- 2023-07-07 Listed $150,000 GPRMLS
- 2021-06-14 Sold (Public Records) $139,000 Public Records
- 2021-06-08 Sold (MLS) $139,000 GPRMLS
- 2021-05-10 Pending — GPRMLS
- 2021-05-04 Listed $120,000 GPRMLS
- 2018-11-06 Sold (Public Records) $83,000 Public Records
- 2018-10-29 Sold (MLS) $83,000 GPRMLS
- 2018-09-25 Pending — GPRMLS
- 2018-09-20 Listed $85,000 GPRMLS
- 2018-09-17 Sold (Public Records) $61,000 Public Records
- 2003-10-03 Listing Removed — GPRMLS
- 2003-04-21 Listed $79,950 GPRMLS
- 1990-10-12 Sold (Public Records) $32,500 Public Records
Property tax history
+4.3%/yrLatest (2025): $2,723 · -2.7% YoY. Source: county tax records.
Cash-flow waterfall
monthlySold comps — $/sqft
last 12 mo · ≤1 miLoading sold comps…