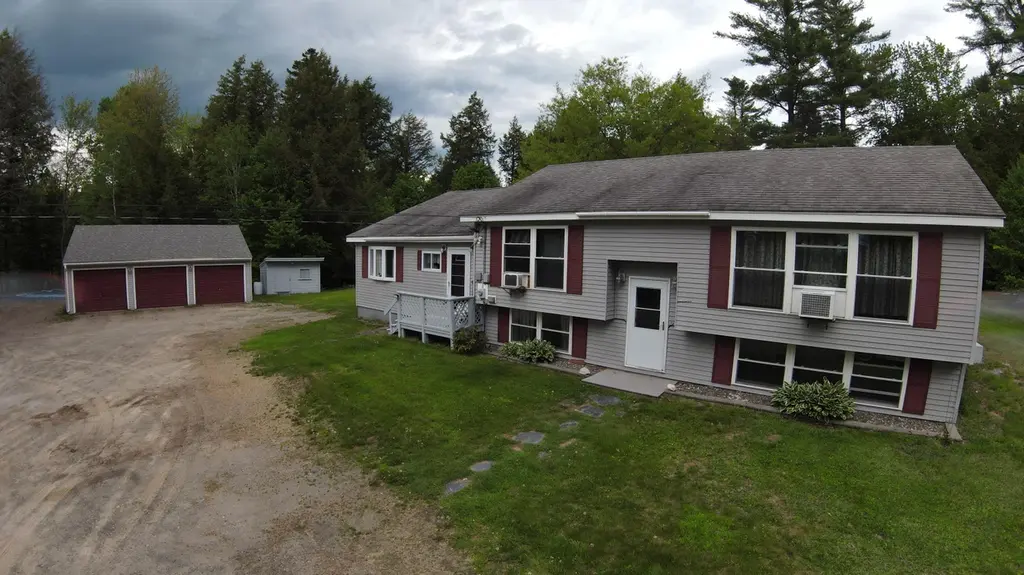
533 Kirkland Rd
Old Town, ME 04468
$449,000C+
4 bd · 2.0 ba ·
1,836 sqft ·
Built 1969
· MultiFamily
· Active
· 22 DOM
Cashflow @ list (25.0% down · 7.5%)
Estimated rent
$4,803/mo
Mortgage (P&I)
−$2,355
Tax + insurance
−$623
HOA
−$0
Vac / Maint / Mgmt
−$1,009
Net cashflow
$817/mo
Annual
$9,803/yr
Cap rate
8.48%
Cash-on-cash
7.80%
DSCR
1.35
1% rule
1.07%
Cash to close
$125,720
Investor read
- This is a 4-bed/2.0-bath multifamily listed at $449k.
- At list price, monthly cash flow is $817 ($10k/yr) — positive.
- The deal already cash-flows at list — no discount required.
- Meets the 1% rule at list price ($5k rent vs $449k).
- It's been on market 22 days — a 2% lower offer ($442k) is reasonable based on typical stale-listing flexibility.
- Recommended offer: $442k (1.5% below list) — sets the bar for market timing.
- Local home prices are declining (-3.0%/yr); year-one equity from $3k of loan paydown is wiped out by about $13k of value loss. Plan a longer hold.
- Location reads 75/100 on livability (#38 in ME, #3,905 nationally) — a middle-class / working-renter tenant base. Strengths: crime A+, cost of living A+, housing A+; Watch: schools D+, employment D, amenities F.
- RSU 34 (suburban): math 81% / reading 83% proficiency, ranked #80 of 112 in ME (top 71%) — strong family-tenant draw, lease renewals of 3-5y typical.
- Market conditions: 46 active listings in the ZIP; 440 units permitted in Penobscot County in 2024 (40 in 5+ unit buildings).
- Penobscot County population projected at -17% by 2050 — secular population decline; favor cash flow + early exit over multi-decade hold.
- 3 sale attempts since 11y ago with the ask held roughly flat each time — persistent listings suggest the price (not the market) is what's stuck; bring a comps-based counter.
- Current owner paid $110k; list at $449k implies a 308% gain — meaningful room to come down on a strong offer.
- Climate carrying-cost: major wind risk, 27% chance of damaging wind over 30y — expect insurance premiums to compound above CPI over the hold.
- Cap rate 8.5% vs local median 6.0% in Old Town — top-decile yield for the area; either an underpriced asset or a hidden risk that comps aren't pricing in. Stress-test before assuming the spread holds.
- At $4,803/mo this rent would consume 102% of the median local household income ($56k/yr) (locally 334% of renters already pay >50% of income on rent) — very limited rent-growth headroom before tenants either downsize or default.
Questions for listing agent
- Built in 1969 — when were the roof, HVAC, electrical panel, plumbing, and water heater last replaced?
- Is there a deadline driving the sale (1031 exchange, divorce, estate, relocation)? That informs how much negotiation room exists.
- Schools are D-rated, which usually means shorter tenancies and higher turnover. Who's the typical renter profile here, and what's been the actual vacancy rate?
- What's the average days-on-market for RENTAL listings here right now (not sales)? A rising rental-DOM trend means longer vacancies and softer asking-rent achievability than the comps imply.
- What's the recent tenant-quality profile in this submarket — average credit score on applications, eviction rate, late-payment / NSF rate, and stable-employment percentage? A property-management company in the area should have these aggregated.
- How much new apartment / multifamily construction is in the pipeline within 1–3 miles? Heavy new supply (>2% of stock underway) typically softens rents 12–24 months out; light construction supports rent growth.
CashFlowRE · CFR-VH34JBDGGK9HST
· Data 6 h ago
cashflowre.app · 2026-05-29