 Multi-family
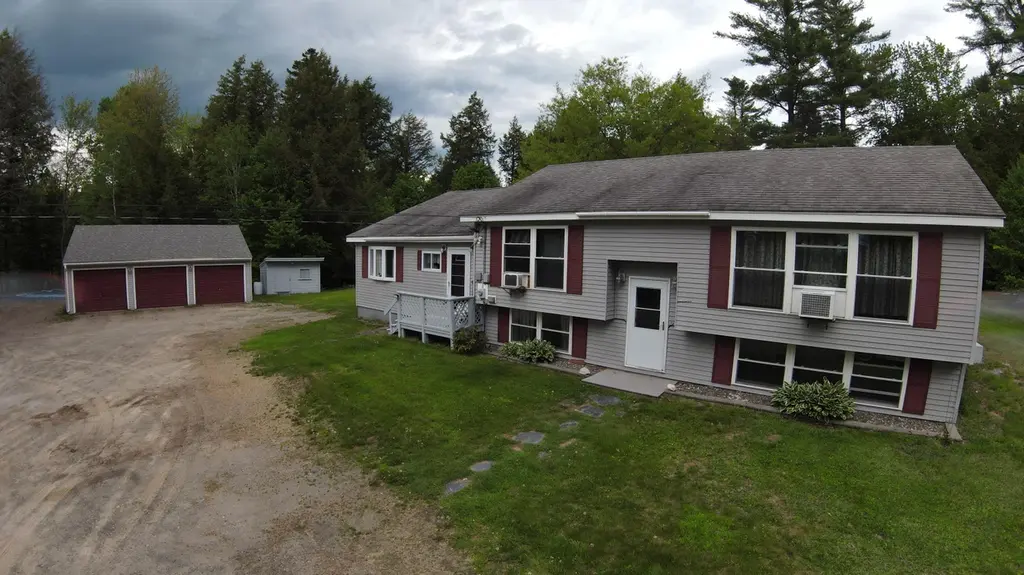
533 Kirkland Rd · Old Town, ME
Flood risk 1/10 · Minimal
- FEMA flood zone
- X (unshaded)
- Chance of flooding over 30 yrs
- 0.0%
- Est. flood insurance / yr
- $473 – $860
Fire risk 2/10 · Minimal
- Est. fire insurance / yr
- $669 – $1,243
Heat risk 2/10 · Minimal
- Hot days now (above 92°F)
- 7 days/yr
- Hot days in 30 yrs
- 15 days/yr
Wind risk 6/10 · Moderate
- Chance of severe wind over 30 yrs
- 27.0%
Air-quality risk 1/10 · Minimal
- Unhealthy air days now
- 0 days/yr
- Unhealthy air days in 30 yrs
- 0 days/yr
Risk factors via First Street. Map © Google.
Why this score? — see what drove the C+ grade
The composite is a weighted blend of 9 inputs, each scored 0–100. Each bar is that input's sub-score; the figure is the points it added to the 100-point composite (weight × sub-score).
- Cash flow +23.2/30.0
- DSCR +7.5/10.0
- ARV discount +7.5/15.0
- Schools +6.8/10.0
- 1% rule +5.7/10.0
- Livability +3.8/5.0
- Rent growth +2.5/5.0
- Condition / age +2.5/5.0
- Appreciation +2.4/10.0
$449,000
🖨 Deal sheet (PDF) 📄 Offer letter ✓ Due diligence
Multi-family units
County records classify this as Multi-Family (2-4 Unit). Listing-text estimate: 1 unit. estimate disagrees with records
Listing remarks MLS
4 bedroom 2.5 raised ranch with rear deck, in law apartment, 3 car detached garage and 5.7 acres. Private location yet minutes to the University of Maine.
Key facts
- In law apartment
- Privacy
- Large open yard
Tags
Property features AI
Finance
- Financial info: R-3 Rural Res zoning
Exterior
- Parking: Detached 3-car garage; Additional gravel parking with 21+ spaces; Vehicle storage with storage area above
- Utilities: Private well water; Private sewer / septic tank; Circuit breakers and generator hookup; Utilities connected; Water heater off heating system
- Home design: Single family residence; Built in 1969
- Construction: Wood frame construction with vinyl siding; Shingle roof; Below-grade finished living area in basement
- Exterior features: Deck; Outbuilding; Near shopping and turnpike/interstate; Rural setting with level, wooded lot; Paved road access
Interior
- Kitchen: Electric range; Gas range; Dishwasher; Refrigerator
- Bedrooms: Multiple bedrooms on the first floor; At least one bedroom located in the basement
- Flooring: Carpet; Laminate; Vinyl
- Bathrooms: 3 full bathrooms
- Heating & cooling: Baseboard heating; Direct vent heater; Hot water heating; Pellet stove
- Interior features: Finished basement with interior entry, bulkhead access, and full basement; Bathtub; In-law floorplan; Double-pane windows; 9 total rooms
- Laundry & utility: Washer; Dryer
Neighborhood map
What this means for you Summary
Snapshot
- This is a 4-bed/2.0-bath multifamily listed at $449k.
Deal economics
- At list price, monthly cash flow is $817 ($10k/yr) — positive.
- The deal already cash-flows at list — no discount required.
- Meets the 1% rule at list price ($5k rent vs $449k).
- Recommended offer: $442k (1.5% below list) — sets the bar for market timing.
- Cap rate 8.5% vs local median 6.0% in Old Town — top-decile yield for the area; either an underpriced asset or a hidden risk that comps aren't pricing in. Stress-test before assuming the spread holds.
Location & tenants
- Location reads 75/100 on livability (#38 in ME, #3,905 nationally) — a middle-class / working-renter tenant base. Strengths: crime A+, cost of living A+, housing A+; Watch: schools D+, employment D, amenities F.
- RSU 34 (suburban): math 81% / reading 83% proficiency, ranked #80 of 112 in ME (top 71%) — strong family-tenant draw, lease renewals of 3-5y typical.
- Market conditions: 46 active listings in the ZIP; 440 units permitted in Penobscot County in 2024 (40 in 5+ unit buildings).
- At $4,803/mo this rent would consume 102% of the median local household income ($56k/yr) (locally 334% of renters already pay >50% of income on rent) — very limited rent-growth headroom before tenants either downsize or default.
Forward outlook
- Local home prices are declining (-3.0%/yr); year-one equity from $3k of loan paydown is wiped out by about $13k of value loss. Plan a longer hold.
- Penobscot County population projected at -17% by 2050 — secular population decline; favor cash flow + early exit over multi-decade hold.
Negotiation context
- It's been on market 20 days — a 2% lower offer ($442k) is reasonable based on typical stale-listing flexibility.
- 3 sale attempts since 11y ago with the ask held roughly flat each time — persistent listings suggest the price (not the market) is what's stuck; bring a comps-based counter.
- Current owner paid $110k; list at $449k implies a 308% gain — meaningful room to come down on a strong offer.
Risks & watch-outs
- Climate carrying-cost: major wind risk, 27% chance of damaging wind over 30y — expect insurance premiums to compound above CPI over the hold.
Questions for the listing agent
- Built in 1969 — when were the roof, HVAC, electrical panel, plumbing, and water heater last replaced?
- Is there a deadline driving the sale (1031 exchange, divorce, estate, relocation)? That informs how much negotiation room exists.
- Schools are D-rated, which usually means shorter tenancies and higher turnover. Who's the typical renter profile here, and what's been the actual vacancy rate?
- What's the average days-on-market for RENTAL listings here right now (not sales)? A rising rental-DOM trend means longer vacancies and softer asking-rent achievability than the comps imply.
- What's the recent tenant-quality profile in this submarket — average credit score on applications, eviction rate, late-payment / NSF rate, and stable-employment percentage? A property-management company in the area should have these aggregated.
- How much new apartment / multifamily construction is in the pipeline within 1–3 miles? Heavy new supply (>2% of stock underway) typically softens rents 12–24 months out; light construction supports rent growth.
Investment metrics
- 1% rule
- 1.07% ✓
- Cap rate
- 8.48%
- Cash-on-cash
- 7.80%
- DSCR
- 1.35
- GRM
- 7.8
CMA / ARV
No comps found within radius.
Projected returns pro-forma
-3.0% appreciation · 3.0% rent growth · sell at horizon
- IRR
- -4.4%
- Equity multiple
- 0.84×
- Total profit
- $-20,731
- Equity at exit
- $66,947
- IRR
- 5.3%
- Equity multiple
- 1.39×
- Total profit
- $48,927
- Equity at exit
- $38,821
Cash invested: $125,720 (down + closing). Projections, not guarantees.
Landlord ↔ Tenant lean methodology
- Overall (STATE)
- 41 Moderately Tenant-Leaning
- State Maine
- 41 Moderately Tenant-Leaning · D+2
- County
- — inherits STATE
- City
- — inherits STATE
ZIP-level market 04468
- Home prices YoY
- -1.8%
- Active inventory
- 46
- Price-to-rent
- 23.4×
Monthly cashflow live
- Estimated rent
- $4,803 medium interval (Pro) →
- Mortgage (P&I)
- −$2,355
- Tax from tax record
- −$436 /mo · $5,229/yr
- Insurance
- −$187
- HOA
- −$0
- Vacancy / Maint / Mgmt
- −$1,009
- Net cashflow
- $817
Break-even live
Sensitivity live
| Price | -10% $1,071 | -5% $944 | +0% $817 | +5% $690 | +10% $563 |
|---|---|---|---|---|---|
| Rent | -10% $437 | -5% $627 | +0% $817 | +5% $1,007 | +10% $1,196 |
| Rate | -1.0pp $1,043 | -0.5pp $931 | base $817 | +0.5pp $701 | +1.0pp $582 |
3-unit breakdown (identical units grouped — click to expand)
| Units | Beds | Baths | Est. rent |
|---|---|---|---|
| 3× units | 2 | 1 | $4,803 |
| #1 | 2 | 1 | $1,601 |
| #2 | 2 | 1 | $1,601 |
| #3 | 2 | 1 | $1,601 |
| Total (3 units) | $4,803 | ||
UW: 25.0% down · 7.5% · 30yr · 1.5% tax · 5.0% vac · 8.0% maint · 8.0% mgmt
Financing live
Cash to close
- Down payment
- $112,250
- Closing costs
- $13,470
- Reserves months
- —
- Total cash needed
- —
Loan-product check · same deal, 3 products live
Conventional
25% down · 7.5% · 30yr
- Down + closing
- —
- Monthly P&I
- —
- Monthly cashflow
- —
- DSCR
- —
- Eligible?
- —
Personal DTI + credit; lowest rate.
DSCR
20% down · 8.5% · 30yr
- Down + closing
- —
- Monthly P&I
- —
- Monthly cashflow
- —
- DSCR
- —
- Eligible?
- —
No personal income docs; deal must DSCR.
Hard money
10% down · 12.0% · 12mo
- Down + closing
- —
- Monthly P&I
- —
- Monthly cashflow
- —
- DSCR
- —
- Eligible?
- —
Short-term bridge; refi at stabilization.
Listing history 15 events
-
2026-06-19days on market $449,000 Active 20 DOM
-
2026-06-18days on market $449,000 Active 19 DOM
-
2026-06-17days on market $449,000 Active 18 DOM
-
2026-06-16days on market $449,000 Active 17 DOM
-
2026-06-15days on market $449,000 Active 16 DOM
-
2026-06-14days on market $449,000 Active 14 DOM
-
2026-06-13days on market $449,000 Active 13 DOM
-
2026-06-10days on market $449,000 Active 11 DOM
-
2026-06-09days on market $449,000 Active 10 DOM
-
2026-06-08days on market $449,000 Active 9 DOM
-
2026-06-07days on market $449,000 Active 8 DOM
-
2026-06-02days on market $449,000 Active 3 DOM
-
2026-06-01days on market $449,000 Active 2 DOM
-
2026-05-30remarks 251-char remark
-
2026-05-30$449,000 Active 1 DOM
ⓘ Source: listings_history table (triggers on properties + properties_extension) + one-shot
backfill from property_details.listing_events for pre-trigger history.
Tax reassessment forecast ME · Partial reset (capped growth)
- Current annual tax
- $5,229 · $436/mo
- Projected year-2 tax
- $5,668 · $472/mo
- Expected delta
- +$439/yr (+$37/mo · 8.4%)
ⓘ Screening estimate from a state-policy table — verify with the county assessor before closing.
Climate risk First Street
- Flood 1/10 Low FEMA zone X (unshaded) · 0% chance over 30 yrs
- Wildfire 2/10 Low
- Heat 2/10 Low 7 d/yr ≥92°F today · 15 d/yr by 30 yrs out
- Wind 6/10 Major 27% chance of damaging wind over 30 yrs
- Air quality 1/10 Low 0 unhealthy d/yr today · 0 by 30 yrs out
Nearby sold comps map
Loading sold comps map…
Walkable amenities ~0.75 mi
Loading nearby amenities…
Taxation est. · year 1
- Rental income
- $57,636
- − Mortgage interest
- −$25,151
- − Property taxes
- −$5,229
- − Insurance
- −$2,245
- − Repairs & maintenance
- −$4,611
- − Management
- −$4,611
- − Depreciation
- −$13,062
- Taxable income
- $2,727
- Est. tax owed @ 24.0%
- −$655
- After-tax cash flow
- $9,149/yr
For passive investors: Depreciation is non-cash, so a rental often shows a tax loss while cash-flowing — sheltering income. Rental losses are passive: they offset passive income freely, and up to $25,000/yr can offset ordinary (W-2) income if you actively participate and your MAGI is under $100k (phasing out to $0 by $150k); unused losses carry forward. On sale, claimed depreciation is recaptured at up to 25%, and gains may owe capital-gains tax (a 1031 exchange can defer both). Figures are a year-1 estimate at your 24.0% rate — not tax advice; consult a CPA.
Schools (NCES district)
- District
- RSU 34
- NCES district ID
- 2314782
- Math proficiency
- 81% ▲ 48.00%
- Reading proficiency
- 83% ▲ 31.00%
- Median HH income
- $39,466
- Composite
- 68.31/100
- National rank
- #351
- State rank
- #80 of 112 in ME
Livability — Old Town
- Score
- 75/100
- State rank
- #38
- US rank
- #3905
Category grades
Schools grade is shown separately in the Schools card above.
Census & demographics
- Census place
- Old Town, ME
- County
- Penobscot County · 81,539 people
- City population
- 9,291
- Metro
- Bangor, ME
- Population (ZIP)
- 9,291
- Household income
- $56,358
- Rent vs Own
- Severe rent burden
- 334.0
Population outlook (Penobscot County) Hauer SSP2
- Today (2025)
- 149,928 people
- By 2030
- 146,386 · -2.4%
- By 2040
- 135,952 · -9.3%
- By 2050
- 123,864 · -17.4%
- By 2075
- 97,825 · -34.8%
- By 2100
- 77,196 · -48.5%
Race, ethnicity, and origin ACS 2023
- Neighborhood character
- Predominantly White (88%)
- Race & ethnicity
- White 88% Native American 6% Two or more races 3% Hispanic / Latino 2%
- Common ancestry
- Lithuanian 18% Slovak 4% Romanian 1%
- Foreign-born
- 2% · Canada
- Languages at home
- 96% English-only · French/Haitian/Cajun 1% Other Indo-European 1%
Political lean MEDSL · Penobscot
- 2024 margin
- R (+10.9) · D 43.6% · R 54.5% · Other 1.9%
- 2008→2024 swing
- -15.9pp toward R · 2008: 5.0pp · 2024: -10.9pp
- All cycles
- 2024: R+10.9 2020: R+8.3 2016: R+10.9 2012: D+2.9 2008: D+5.0
Not yet ingested
- Civics
- —
Market trends
- HPI YoY
- ▼ -5.29%
- Current HPI
- 285.3183
- Rent YoY
- —
- Metro
- Bangor, ME
- State GDP YoY
- —
- F500 in state
- 0
Price history
+199.5% since first listed8 events — show timeline
- 2026-05-30 Listed $449,000 MREIS
- 2026-04-28 Delisted — MREIS
- 2026-02-18 Price Changed $475,000 MREIS
- 2025-11-04 Listed $479,000 MREIS
- 2016-03-25 Sold (MLS) $110,000 MREIS
- 2016-02-16 Pending — MREIS
- 2016-02-05 Price Changed $124,900 MREIS
- 2015-12-29 Listed $149,900 MREIS
Property tax history
+3.3%/yrLatest (2025): $5,229 · +11.9% YoY. Source: county tax records.
Cash-flow waterfall
monthlySold comps — $/sqft
last 12 mo · ≤1 miLoading sold comps…