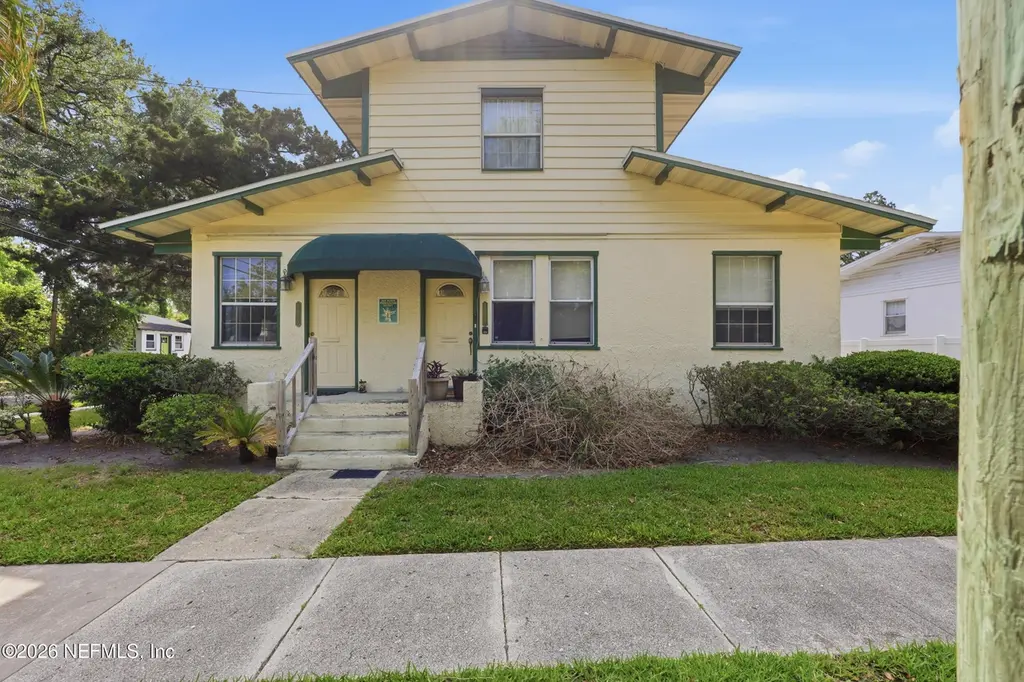
1805 Perry Pl
Jacksonville, FL 32207
$645,000F
4 bd · 3.0 ba ·
1,878 sqft ·
Built 1918
· MultiFamily
· Active
· 41 DOM
Cashflow @ list (25.0% down · 7.5%)
Estimated rent
$4,185/mo
Mortgage (P&I)
−$3,382
Tax + insurance
−$745
HOA
−$0
Vac / Maint / Mgmt
−$879
Net cashflow
$-821/mo
Annual
$-9,855/yr
Cap rate
4.89%
Cash-on-cash
-5.02%
DSCR
0.78
1% rule
0.65%
Cash to close
$180,600
Investor read
- This is a 1×2bd/1ba + 3×1bd/1ba units multifamily listed at $645k.
- At list price, monthly cash flow is $-821 ($-10k/yr) — negative. Per door: $-205/mo.
- To cash-flow at today's rent, offer at most $500k (22.5% below list).
- To meet the 1% rule (rent ≥ 1% of price), the offer needs to be $418k (35.1% below list).
- It's been on market 41 days — a 3% lower offer ($626k) is reasonable based on typical stale-listing flexibility.
- Recommended offer: $418k (35.1% below list) — sets the bar for 1% rule.
- Local home prices are declining (-3.0%/yr); year-one equity from $4k of loan paydown is wiped out by about $19k of value loss. Plan a longer hold.
- Location reads 83/100 on livability (#50 in FL, #911 nationally) — a professional / high-income tenant draw. Strengths: amenities A+, commute A+, housing A+.
- Duval (urban): math 46% / reading 45% proficiency, ranked #48 of 73 in FL (top 66%) — families likely to look elsewhere, expect single-tenant / working-renter base with shorter leases.
- Watch-outs: flood insurance adds $66/mo; built in 1918 — expect roof / HVAC / electrical / plumbing capex.
- Market conditions: Rents soft (-0.2%/yr); 219 active listings in the ZIP; 20 comparable units currently listed for rent nearby; rentals leasing fast (median 12d on market — plan ~1-2 weeks tenant-placement turnaround); 6,503 units permitted in Duval County in 2024 (1,131 in 5+ unit buildings).
- Duval County population projected at +19% by 2050 — long-run rental-demand tailwind backs the buy-and-hold thesis.
- Current owner paid $220k; list at $645k implies a 193% gain — meaningful room to come down on a strong offer.
- Climate carrying-cost: major flood risk; severe wind risk, 99% chance of damaging wind over 30y; extreme-heat days projected 7→20/yr by 2055 (HVAC capex compounding) — expect insurance premiums to compound above CPI over the hold.
- Cap rate 4.9% vs local median 4.0% in Jacksonville — meaningfully above typical; check what's discounted (condition, days-on-market, listing class) to confirm the premium yield is real.
- At $4,185/mo this rent would consume 77% of the median local household income ($65k/yr) (locally 1730% of renters already pay >50% of income on rent) — very limited rent-growth headroom before tenants either downsize or default.
Questions for listing agent
- What do current leases actually rent for vs. the listed asking? Can we see a recent rent roll and the last 12 months of T-12 income?
- It's been on market 41 days. Have you received any prior offers? Is the seller open to a 35% concession, seller financing, or rate buy-down credit?
- Can we see the unit-by-unit rent roll, current vacancy, and any below-market leases? What's the average tenancy length?
- What capital expenditures (roof, boiler, parking lot, exteriors) have been made in the last 5 years, and what's planned in the next 2?
- Built in 1918 — when were the roof, HVAC, electrical panel, plumbing, and water heater last replaced?
- What's the actual annual flood-insurance premium (NFIP or private), and is the property in a SFHA with mandatory coverage?
- Is there a deadline driving the sale (1031 exchange, divorce, estate, relocation)? That informs how much negotiation room exists.
- Schools are B-rated — typically a magnet for longer-tenancy family renters. What's the average tenant stay here, and is there a school-zone premium baked into asking?
CashFlowRE · CFR-VHT7XR6C0FMVM4
· Data 2 days ago
cashflowre.app · 2026-05-29