 Fourplex
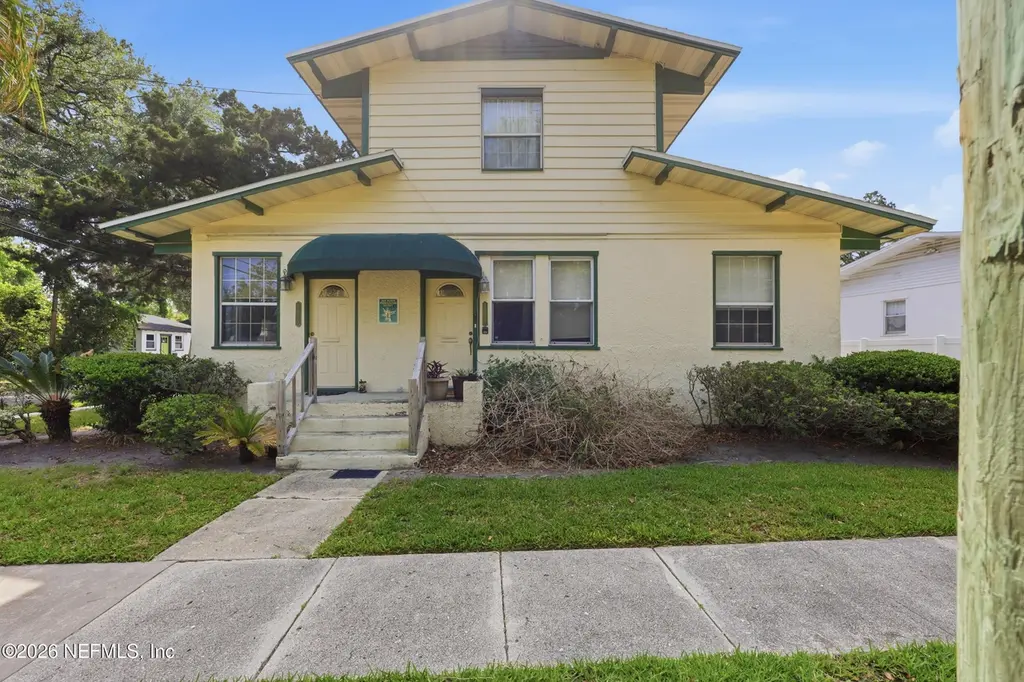
1805 Perry Pl · Jacksonville, FL
Flood risk 7/10 · Major
- FEMA flood zone
- X (unshaded)
- Chance of flooding over 30 yrs
- 0.76%
- Est. flood insurance / yr
- $507 – $1,088
Fire risk 1/10 · Minimal
- Est. fire insurance / yr
- $947 – $1,759
Heat risk 9/10 · Severe
- Hot days now (above 107°F)
- 7 days/yr
- Hot days in 30 yrs
- 20 days/yr
Wind risk 9/10 · Severe
- Chance of severe wind over 30 yrs
- 99.0%
Air-quality risk 4/10 · Minor
- Unhealthy air days now
- 6 days/yr
- Unhealthy air days in 30 yrs
- 6 days/yr
Risk factors via First Street. Map © Google.
Why this score? — see what drove the F grade
The composite is a weighted blend of 9 inputs, each scored 0–100. Each bar is that input's sub-score; the figure is the points it added to the 100-point composite (weight × sub-score).
- Cash flow +7.7/30.0
- ARV discount +7.5/15.0
- Livability +4.2/5.0
- Schools +3.9/10.0
- Rent growth +2.5/5.0
- Condition / age +2.5/5.0
- DSCR +1.8/10.0
- 1% rule +1.5/10.0
- Appreciation +0.0/10.0
$645,000
🖨 Deal sheet 📄 Offer letter ✓ Due diligence
Multi-family units
County records classify this as Multi-Family (5+ Unit). Listing-text estimate: 4 units. estimate disagrees with records
5+ unit building — per-unit beds/baths from public records are typically unavailable; the breakdown below (if shown) is an estimate from the listing text.
Listing remarks
RARE INVESTMENT OPPORTUNITY in the Heart of San Marco! Don't miss this exceptional chance to own a fully occupied, income-producing 4-unit property in one of Jacksonville's most sought-after historic neighborhoods. Offering a unique blend of timeless charm, strong rental history, and future upside potential, this property is ideal for investors looking to expand their portfolio in a high-demand location. The property features a spacious lower-level 2-bedroom, 1-bath apartment complete with private laundry and a cozy fireplace, an additional lower-level 1-bedroom unit, an upstairs studio apartment, and a detached 1-bedroom studio apartment. Each residence showcases distinctive character with
Key facts
- Income producing
- Fully occupied
- 5,662 sq ft lot
Tags
Property features AI
Finance
- Financial info: Offered as a multi-family investment (quadruplex)
Exterior
- Parking: Additional off-street parking
- Utilities: Public sewer; Cable available; Electricity connected; Sewer connected; Water connected
- Home design: Quadruplex (multi-family investment); Two stories; Property attached
- Construction: Shingle roof; 2 buildings on the parcel
- Exterior features: Courtyard; Back yard; Corner lot; City street frontage; Asphalt road surface
Interior
- Kitchen: Electric range; Microwave; Refrigerator
- Bedrooms: 5 bedrooms
- Flooring: Carpet; Laminate; Tile
- Bathrooms: 4 full bathrooms
- Heating & cooling: Central heating (electric); Central air; Electric cooling; Wall/window AC units
- Interior features: Courtyard; Corner lot; Chain link fencing; Two-level layout; Property is attached (multi-unit)
- Laundry & utility: In-unit laundry (lower level); Washer; Dryer
Neighborhood map
What this means for you Summary
Snapshot
- This is a 1×2bd/1ba + 3×1bd/1ba units multifamily listed at $645k.
Deal economics
- At list price, monthly cash flow is $-821 ($-10k/yr) — negative. Per door: $-205/mo.
- To cash-flow at today's rent, offer at most $500k (22.5% below list).
- To meet the 1% rule (rent ≥ 1% of price), the offer needs to be $418k (35.1% below list).
- Recommended offer: $418k (35.1% below list) — sets the bar for 1% rule.
- Cap rate 4.9% vs local median 4.0% in Jacksonville — meaningfully above typical; check what's discounted (condition, days-on-market, listing class) to confirm the premium yield is real.
Location & tenants
- Location reads 83/100 on livability (#50 in FL, #911 nationally) — a professional / high-income tenant draw. Strengths: amenities A+, commute A+, housing A+.
- Duval (urban): math 46% / reading 45% proficiency, ranked #48 of 73 in FL (top 66%) — families likely to look elsewhere, expect single-tenant / working-renter base with shorter leases.
- Market conditions: Rents soft (-0.2%/yr); 219 active listings in the ZIP; 20 comparable units currently listed for rent nearby; rentals leasing fast (median 12d on market — plan ~1-2 weeks tenant-placement turnaround); 6,503 units permitted in Duval County in 2024 (1,131 in 5+ unit buildings).
- At $4,185/mo this rent would consume 77% of the median local household income ($65k/yr) (locally 1730% of renters already pay >50% of income on rent) — very limited rent-growth headroom before tenants either downsize or default.
Forward outlook
- Local home prices are declining (-3.0%/yr); year-one equity from $4k of loan paydown is wiped out by about $19k of value loss. Plan a longer hold.
- Duval County population projected at +19% by 2050 — long-run rental-demand tailwind backs the buy-and-hold thesis.
Negotiation context
- It's been on market 41 days — a 3% lower offer ($626k) is reasonable based on typical stale-listing flexibility.
- Current owner paid $220k; list at $645k implies a 193% gain — meaningful room to come down on a strong offer.
Risks & watch-outs
- Watch-outs: flood insurance adds $66/mo; built in 1918 — expect roof / HVAC / electrical / plumbing capex.
- Climate carrying-cost: major flood risk; severe wind risk, 99% chance of damaging wind over 30y; extreme-heat days projected 7→20/yr by 2055 (HVAC capex compounding) — expect insurance premiums to compound above CPI over the hold.
Questions for the listing agent
- What do current leases actually rent for vs. the listed asking? Can we see a recent rent roll and the last 12 months of T-12 income?
- It's been on market 41 days. Have you received any prior offers? Is the seller open to a 35% concession, seller financing, or rate buy-down credit?
- Can we see the unit-by-unit rent roll, current vacancy, and any below-market leases? What's the average tenancy length?
- What capital expenditures (roof, boiler, parking lot, exteriors) have been made in the last 5 years, and what's planned in the next 2?
- Built in 1918 — when were the roof, HVAC, electrical panel, plumbing, and water heater last replaced?
- What's the actual annual flood-insurance premium (NFIP or private), and is the property in a SFHA with mandatory coverage?
- Is there a deadline driving the sale (1031 exchange, divorce, estate, relocation)? That informs how much negotiation room exists.
- Schools are B-rated — typically a magnet for longer-tenancy family renters. What's the average tenant stay here, and is there a school-zone premium baked into asking?
- The area grade is low — what's the realistic commute time and amenity access for the typical tenant pool here? Any planned neighborhood developments (good or bad) we should know about?
- What's the average days-on-market for RENTAL listings here right now (not sales)? A rising rental-DOM trend means longer vacancies and softer asking-rent achievability than the comps imply.
- What's the recent tenant-quality profile in this submarket — average credit score on applications, eviction rate, late-payment / NSF rate, and stable-employment percentage? A property-management company in the area should have these aggregated.
- How much new apartment / multifamily construction is in the pipeline within 1–3 miles? Heavy new supply (>2% of stock underway) typically softens rents 12–24 months out; light construction supports rent growth.
Investment metrics
- 1% rule
- 0.65% ✗
- Cap rate
- 4.89%
- Cash-on-cash
- -5.02%
- DSCR
- 0.78
- GRM
- 12.8
CMA / ARV
No comps found within radius.
Projected returns pro-forma
-3.0% appreciation · 0.0% rent growth · sell at horizon
- IRR
- -28.7%
- Equity multiple
- 0.06×
- Total profit
- $-169,229
- Equity at exit
- $96,172
- IRR
- -43.9%
- Equity multiple
- -0.45×
- Total profit
- $-262,681
- Equity at exit
- $55,768
Cash invested: $180,600 (down + closing). Projections, not guarantees.
Landlord ↔ Tenant lean methodology
- Overall (STATE)
- 87 Strongly Landlord-Friendly
- State Florida
- 87 Strongly Landlord-Friendly · R+3
- County
- — inherits STATE
- City
- — inherits STATE
ZIP-level market 32207
- Rents YoY
- -0.2%
- Active inventory
- 219
- Price-to-rent
- 44.6×
Monthly cashflow live
- Estimated rent
- $4,185 medium interval (Pro) →
- Mortgage (P&I)
- −$3,382
- Tax from tax record
- −$410 /mo · $4,917/yr
- Insurance
- −$269
- Flood insurance flood zone
- −$66 /mo · $798/yr
- HOA
- −$0
- Vacancy / Maint / Mgmt
- −$879
- Net cashflow
- $-821
Break-even live
4-unit breakdown (identical units grouped — click to expand)
| Units | Beds | Baths | Est. rent |
|---|---|---|---|
| 1× unit | 2 | 1 | $1,205 |
| 3× units | 1 | 1 | $2,979 |
| #2 | 1 | 1 | $993 |
| #3 | 1 | 1 | $993 |
| #4 | 1 | 1 | $993 |
| Total (4 units) | $4,185 | ||
UW: 25.0% down · 7.5% · 30yr · 1.5% tax · 5.0% vac · 8.0% maint · 8.0% mgmt
Financing live
Cash to close
- Down payment
- $161,250
- Closing costs
- $19,350
- Reserves months
- —
- Total cash needed
- —
Loan-product check · same deal, 3 products live
Conventional
25% down · 7.5% · 30yr
- Down + closing
- —
- Monthly P&I
- —
- Monthly cashflow
- —
- DSCR
- —
- Eligible?
- —
Personal DTI + credit; lowest rate.
DSCR
20% down · 8.5% · 30yr
- Down + closing
- —
- Monthly P&I
- —
- Monthly cashflow
- —
- DSCR
- —
- Eligible?
- —
No personal income docs; deal must DSCR.
Hard money
10% down · 12.0% · 12mo
- Down + closing
- —
- Monthly P&I
- —
- Monthly cashflow
- —
- DSCR
- —
- Eligible?
- —
Short-term bridge; refi at stabilization.
Rent comps 20 comps
| Address | Beds | Baths | Sqft | Rent | $/sqft | DOM | Units | Dist |
|---|---|---|---|---|---|---|---|---|
| 1900 Olevia St Jacksonville, FL | 1.0–3.0 | 1.0–3.0 | 1127 | $2,693 | $2.39 | 2d | 6 | 0.22mi |
| 2304 Bethune Ave Jacksonville, FL | 3.0 | 2.0 | 1316 | $3,000 | $2.28 | 23d | 1 | 0.34mi |
| 1651 Flagler Ave Jacksonville, FL | 3.0 | 2.5 | 1701 | $2,100 | $1.23 | 16d | 1 | 0.42mi |
| 1928 Prudential Dr Jacksonville, FL | 3.0 | 3.5 | 1745 | $3,350 | $1.92 | 23d | 1 | 0.43mi |
| 1244 Landon Ave Unit 3 Jacksonville, FL | 3.0 | 2.0 | 1383 | $1,795 | $1.30 | 7d | 1 | 0.44mi |
| 2054 Prudential Dr Jacksonville, FL | 3.0 | 3.5 | 1990 | $6,000 | $3.02 | 14d | 1 | 0.51mi |
| 2056 Prudential Dr Jacksonville, FL | 3.0 | 3.5 | 2144 | $6,495 | $3.03 | 14d | 1 | 0.51mi |
| 1905 Promenade Way Jacksonville, FL | 1.0–3.0 | 1.0–3.0 | 1045 | $2,549 | $2.44 | 1d | 35 | 0.51mi |
| 1655 Prudential Dr Jacksonville, FL | 3.0 | 1.0–3.0 | 1113 | $3,314 | $2.98 | 3d | 13 | 0.56mi |
| 1401 Riverplace Blvd Jacksonville, FL | 1.0–3.0 | 1.0–2.0 | 1401 | $4,424 | $3.16 | 4d | 9 | 0.78mi |
| 1377 Tiber Ave Jacksonville, FL | 3.0 | 2.0 | 1304 | $2,200 | $1.69 | 14d | 1 | 1.08mi |
| 1720 Boulder St Jacksonville, FL | 3.0 | 1.5 | 1540 | $2,350 | $1.53 | 23d | 1 | 1.34mi |
| 1720 Boulder St Jacksonville, FL | 3.0 | 1.5 | 1540 | $2,350 | $1.53 | 12d | 1 | 1.34mi |
| 2032 Inwood Ter Jacksonville, FL | 3.0 | 2.0 | 1336 | $2,000 | $1.50 | 3d | 1 | 1.36mi |
| 3460 Beach Blvd Jacksonville, FL | 1.0–3.0 | 1.0–3.0 | 1061 | $2,299 | $2.17 | 1d | 56 | 1.36mi |
| 138 E Duval St Jacksonville, FL | 3.0 | 1.5 | 1450 | $3,200 | $2.21 | 23d | 1 | 1.38mi |
| 343 E Church St Jacksonville, FL | 3.0 | 3.5 | 1530 | $2,195 | $1.43 | 3d | 1 | 1.39mi |
| 2135 Ashland St Jacksonville, FL | 3.0 | 2.5 | 1433 | $1,700 | $1.19 | 23d | 1 | 1.42mi |
| 2042 Sheridan St Jacksonville, FL | 3.0 | 2.0 | 1330 | $1,736 | $1.31 | 4d | 1 | 1.47mi |
| 700 E Union St Jacksonville, FL | 1.0–3.0 | 1.0–2.0 | 1070 | $3,185 | $2.98 | 4d | 63 | 1.48mi |
Listing history 18 events
-
2026-06-18days on market $645,000 Active 41 DOM
-
2026-06-17days on market $645,000 Active 40 DOM
-
2026-06-16days on market $645,000 Active 39 DOM
-
2026-06-15days on market $645,000 Active 38 DOM
-
2026-06-13days on market $645,000 Active 35 DOM
-
2026-06-10days on market $645,000 Active 32 DOM
-
2026-06-08days on market $645,000 Active 31 DOM
-
2026-06-07pricedays on market $645,000 Active 30 DOM
-
2026-06-05days on market $695,000 Active 27 DOM
-
2026-06-03days on market $695,000 Active 26 DOM
-
2026-06-02days on market $695,000 Active 25 DOM
-
2026-06-01days on market $695,000 Active 24 DOM
-
2026-05-31days on market $695,000 Active 23 DOM
-
2026-05-08$695,000 Active
-
2023-06-16historical
-
2011-02-03soldstatus $220,000
-
1997-03-12soldstatus $43,500
-
1986-02-01soldstatus $47,500
ⓘ Source: listings_history table (triggers on properties + properties_extension) + one-shot
backfill from property_details.listing_events for pre-trigger history.
Tax reassessment forecast FL · Resets to sale price
- Current annual tax
- $4,917 · $410/mo
- Projected year-2 tax
- $5,354 · $446/mo
- Expected delta
- +$436/yr (+$36/mo · 8.9%)
ⓘ Screening estimate from a state-policy table — verify with the county assessor before closing.
Climate risk First Street
- Flood 7/10 Severe FEMA zone X (unshaded) · 76% chance over 30 yrs
- Wildfire 1/10 Low
- Heat 9/10 Extreme 7 d/yr ≥107°F today · 20 d/yr by 30 yrs out
- Wind 9/10 Extreme 99% chance of damaging wind over 30 yrs
- Air quality 4/10 Moderate 6 unhealthy d/yr today · 6 by 30 yrs out
Nearby sold comps map
Loading sold comps map…
Walkable amenities ~0.75 mi
Loading nearby amenities…
Taxation est. · year 1
- Rental income
- $50,220
- − Mortgage interest
- −$36,130
- − Property taxes
- −$4,917
- − Insurance
- −$4,022
- − Repairs & maintenance
- −$4,018
- − Management
- −$4,018
- − Depreciation
- −$18,764
- Taxable loss
- −$21,649
- Est. tax savings @ 24.0%
- +$5,196
- After-tax cash flow
- $-4,660/yr
For passive investors: Depreciation is non-cash, so a rental often shows a tax loss while cash-flowing — sheltering income. Rental losses are passive: they offset passive income freely, and up to $25,000/yr can offset ordinary (W-2) income if you actively participate and your MAGI is under $100k (phasing out to $0 by $150k); unused losses carry forward. On sale, claimed depreciation is recaptured at up to 25%, and gains may owe capital-gains tax (a 1031 exchange can defer both). Figures are a year-1 estimate at your 24.0% rate — not tax advice; consult a CPA.
Schools (NCES district)
- District
- Duval
- NCES district ID
- 1200480
- Math proficiency
- 46% ▼ -11.00%
- Reading proficiency
- 45% ▼ -4.00%
- Median HH income
- $48,987
- Composite
- 38.97/100
- National rank
- #4076
- State rank
- #48 of 73 in FL
Livability — Jacksonville
- Score
- 83/100
- State rank
- #50
- US rank
- #911
Category grades
Schools grade is shown separately in the Schools card above.
Census & demographics
- Census place
- Jacksonville, FL
- County
- Duval County · 1,015,274 people
- City population
- 979,034
- Metro
- Jacksonville, FL
- Population (ZIP)
- 36,998
- Household income
- $65,234
- Rent vs Own
- Severe rent burden
- 1730.0
Population outlook (Duval County) Hauer SSP2
- Today (2025)
- 1,013,010 people
- By 2030
- 1,059,228 · +4.6%
- By 2040
- 1,141,439 · +12.7%
- By 2050
- 1,205,258 · +19.0%
- By 2075
- 1,324,282 · +30.7%
- By 2100
- 1,319,620 · +30.3%
Race, ethnicity, and origin ACS 2023
- Neighborhood character
- Diverse neighborhood (Simpson 0.63)
- Race & ethnicity
- White 56% Black 16% Hispanic / Latino 15% Asian 9% Two or more races 9%
- Hispanic origin (detail)
- Mexican 2% Puerto Rican 3% Cuban 4%
- Common ancestry
- Slovak 2% Italian 2% Serbian 1%
- Foreign-born
- 17% · Canada, Philippines, China
- Languages at home
- 76% English-only · Spanish 12% Other Asian/Pacific 5% Arabic 1%
Political lean MEDSL · Duval
- 2024 margin
- Toss-up / Even · D 48.7% · R 50.1% · Other 1.2%
- 2008→2024 swing
- +0.4pp no change · 2008: -1.9pp · 2024: -1.5pp
- All cycles
- 2024: R+1.5 2020: D+3.8 2016: R+1.5 2012: R+3.6 2008: R+1.9
Not yet ingested
- Civics
- —
Market trends
- HPI YoY
- ▼ -299.33%
- Current HPI
- 310.9037
- Rent YoY
- ▼ -0.20%
- Metro
- Jacksonville, FL
- State GDP YoY
- ▲ 3.28%
- F500 in state
- 36
Industry mix (Fortune 500 HQ in FL)
| Industry | F500 HQs | Revenue |
|---|---|---|
| Industrial Technology | 2 | $29B |
|
||
| Insurance | 2 | $17B |
|
||
| Retail | 1 | $60B |
|
||
| Technology Distribution | 1 | $58B |
|
||
| Homebuilding | 1 | $35B |
|
||
| Technology Manufacturing | 1 | $35B |
|
||
Price history
+1363.2% since first listed5 events — show timeline
- 2026-05-08 Listed $695,000 realMLS
- 2023-06-16 Rental Removed — NEFLMLS
- 2011-02-03 Sold (Public Records) $220,000 Public Records
- 1997-03-12 Sold (Public Records) $43,500 Public Records
- 1986-02-01 Sold (Public Records) $47,500 Public Records
Property tax history
+5.7%/yrLatest (2025): $4,917 · +21.3% YoY. Source: county tax records.
Cash-flow waterfall
monthlySold comps — $/sqft
last 12 mo · ≤1 miLoading sold comps…