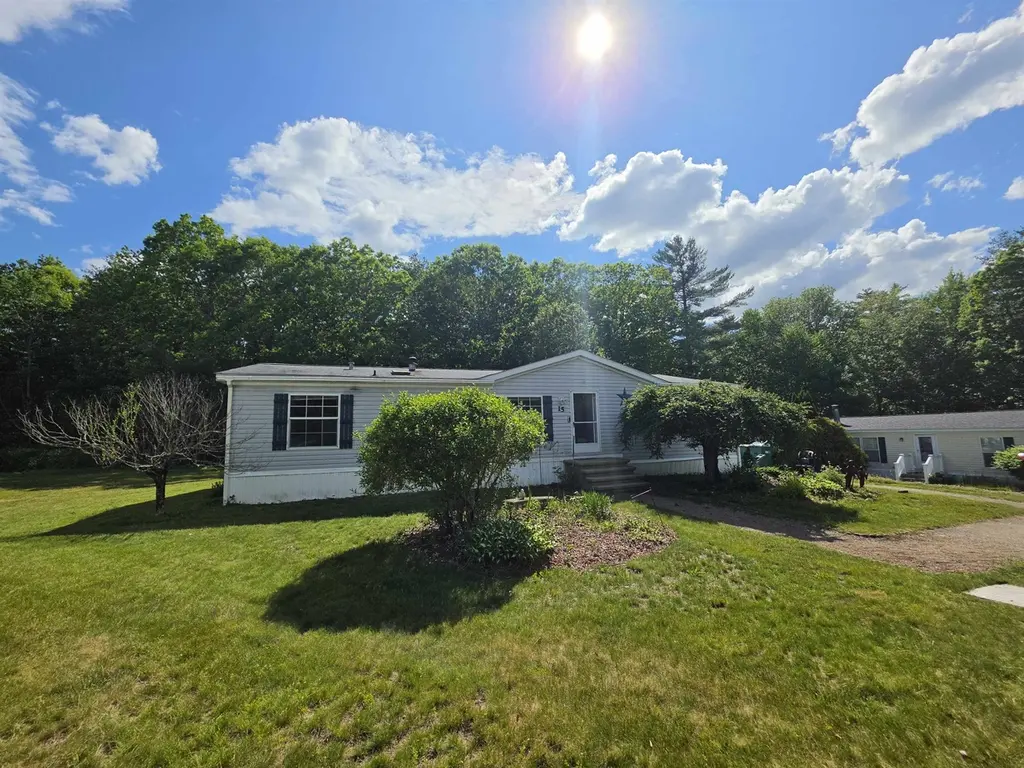
15 Country Ln
Raymond, NH 03044
$259,900D+
3 bd · 2.0 ba ·
1,404 sqft ·
Built 2000
· Manufactured
· Active
· 23 DOM
Cashflow @ list (25.0% down · 7.5%)
Estimated rent
$3,000/mo
Mortgage (P&I)
−$1,363
Tax + insurance
−$425
HOA
−$630
Vac / Maint / Mgmt
−$630
Net cashflow
$-48/mo
Annual
$-580/yr
Cap rate
6.07%
Cash-on-cash
-0.80%
DSCR
0.96
1% rule
1.15%
Cash to close
$72,772
Investor read
- This is a 3-bed/2.0-bath manufactured listed at $260k.
- At list price, monthly cash flow is $-48 ($-580/yr) — negative.
- To cash-flow at today's rent, offer at most $251k (3.3% below list).
- Meets the 1% rule at list price ($3k rent vs $260k).
- It's been on market 23 days — a 2% lower offer ($256k) is reasonable based on typical stale-listing flexibility.
- Recommended offer: $251k (3.3% below list) — sets the bar for cash-flow.
- Local home prices are declining (-3.0%/yr); year-one equity from $2k of loan paydown is wiped out by about $8k of value loss. Plan a longer hold.
- Location reads 67/100 on livability (#63 in NH) — a middle-class / working-renter tenant base. Strengths: crime A+, housing A, health & safety A; Watch: amenities F, commute F.
- Fremont School District (rural): math 28% / reading 43% proficiency, ranked #67 of 98 in NH (top 68%) — families likely to look elsewhere, expect single-tenant / working-renter base with shorter leases; only 12% free/reduced lunch — higher-income household profile.
- Zoned schools: Ellis School (math 28% / reading 43%, grade F, #177 of 263 statewide, top 67%, 375 students, 12% FRL) — zoned schools at 12% FRL track the district average.
- Watch-outs: HOA is 21% of rent.
- Market conditions: 16 active listings in the ZIP; 1 comparable units currently listed for rent nearby; 1,276 units permitted in Rockingham County in 2024 (593 in 5+ unit buildings).
- 4 sale attempts since 12y ago with the ask held roughly flat each time — persistent listings suggest the price (not the market) is what's stuck; bring a comps-based counter.
- Current owner paid $128k; list at $260k implies a 103% gain — meaningful room to come down on a strong offer.
- Climate carrying-cost: major flood risk; major wind risk, 27% chance of damaging wind over 30y — expect insurance premiums to compound above CPI over the hold.
- Cap rate 6.1% vs local median 2.2% in Raymond — top-decile yield for the area; either an underpriced asset or a hidden risk that comps aren't pricing in. Stress-test before assuming the spread holds.
Questions for listing agent
- What do current leases actually rent for vs. the listed asking? Can we see a recent rent roll and the last 12 months of T-12 income?
- What does the HOA fee cover, when was the last increase, and are there any pending special assessments or reserve-fund shortfalls?
- Is there a deadline driving the sale (1031 exchange, divorce, estate, relocation)? That informs how much negotiation room exists.
- The area grade is low — what's the realistic commute time and amenity access for the typical tenant pool here? Any planned neighborhood developments (good or bad) we should know about?
- What's the average days-on-market for RENTAL listings here right now (not sales)? A rising rental-DOM trend means longer vacancies and softer asking-rent achievability than the comps imply.
- What's the recent tenant-quality profile in this submarket — average credit score on applications, eviction rate, late-payment / NSF rate, and stable-employment percentage? A property-management company in the area should have these aggregated.
- How much new for-sale + rental construction is in the pipeline within 1–3 miles? Heavy new supply typically softens prices + rents 12–24 months out; constrained supply supports both.
CashFlowRE · CFR-VJV3PC8SJBHB28
· Data 1 day ago
cashflowre.app · 2026-05-29