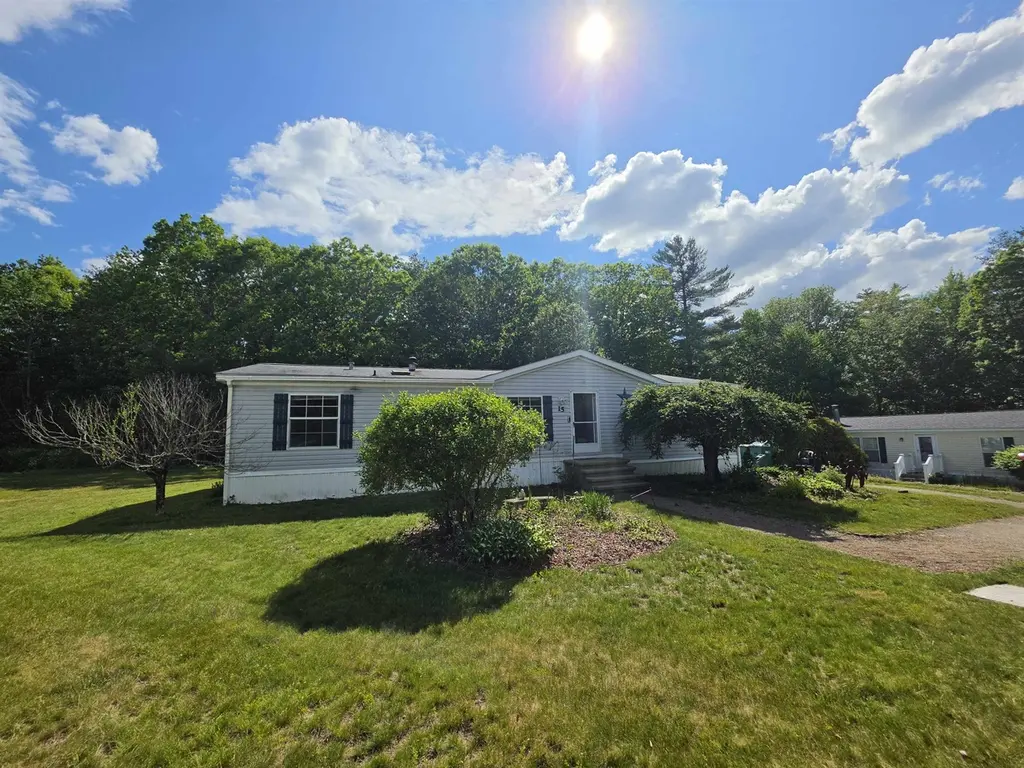
15 Country Ln · Raymond, NH
Flood risk 6/10 · Moderate
- FEMA flood zone
- X (unshaded)
- Chance of flooding over 30 yrs
- 0.7%
- Est. flood insurance / yr
- $507 – $1,088
Fire risk 3/10 · Minor
- Est. fire insurance / yr
- $507 – $941
Heat risk 4/10 · Minor
- Hot days now (above 96°F)
- 7 days/yr
- Hot days in 30 yrs
- 15 days/yr
Wind risk 6/10 · Moderate
- Chance of severe wind over 30 yrs
- 27.0%
Air-quality risk 2/10 · Minimal
- Unhealthy air days now
- 2 days/yr
- Unhealthy air days in 30 yrs
- 2 days/yr
Risk factors via First Street. Map © Google.
Why this score? — see what drove the D+ grade
The composite is a weighted blend of 9 inputs, each scored 0–100. Each bar is that input's sub-score; the figure is the points it added to the 100-point composite (weight × sub-score).
- ARV discount +15.0/15.0
- Cash flow +12.3/30.0
- 1% rule +6.5/10.0
- DSCR +3.6/10.0
- Schools +3.4/10.0
- Livability +3.4/5.0
- Rent growth +2.5/5.0
- Condition / age +2.5/5.0
- Appreciation +0.0/10.0
$259,900
🖨 Deal sheet (PDF) 📄 Offer letter ✓ Due diligence
Listing remarks MLS
Step inside this spacious 3 bedroom double wide home on a great lot in desirable Fremont NH park. This home is a must see with cathedral ceilings, kitchen with island, open concept living room and a dining area that has access to your great back deck and back yard. The 3 bedrooms include a large master suite with soaking tub, shower and double closets. You will love the yard with your own huge Cottage style shed with 2 rooms and electrical, big driveway for plenty of parking and lovely landscaping. Schedule your showing today. .. Delayed showings until 10/28/2019 . .. 55+ park but exceptions CAN be made for owners under 55.. .
Key facts
- Laminate flooring
- Pellet stove
- Jacuzzi tub
Tags
Property features AI
Finance
- Other: Road frontage managed by association
- HOA & community: Monthly park rent of $630; One-time fees: $100 (other) and $100 buy-in fee
Exterior
- Parking: Paved driveway
- Utilities: Community sewer; Community water; Circuit breaker electrical panel; Cable available; Internet availability unknown
- Home design: Double wide manufactured home; Grey exterior; Shingle - asphalt roof; Built in 2000; Existing construction
- Construction: Vinyl siding; Manufactured home construction
- Exterior features: Country setting; Paved driveway; Mobile park name: Poplin Eatates; Mobile park approval in place; Mobile co-op community
Interior
- Bathrooms: Two full bathrooms
- Heating & cooling: Hot air heating
- Interior features: Six total rooms
Neighborhood map
What this means for you Summary
Snapshot
- This is a 3-bed/2.0-bath manufactured listed at $260k.
Deal economics
- At list price, monthly cash flow is $-48 ($-580/yr) — negative.
- To cash-flow at today's rent, offer at most $251k (3.3% below list).
- Meets the 1% rule at list price ($3k rent vs $260k).
- Recommended offer: $251k (3.3% below list) — sets the bar for cash-flow.
- Cap rate 6.1% vs local median 2.2% in Raymond — top-decile yield for the area; either an underpriced asset or a hidden risk that comps aren't pricing in. Stress-test before assuming the spread holds.
Location & tenants
- Location reads 67/100 on livability (#63 in NH) — a middle-class / working-renter tenant base. Strengths: crime A+, housing A, health & safety A; Watch: amenities F, commute F.
- Fremont School District (rural): math 28% / reading 43% proficiency, ranked #67 of 98 in NH (top 68%) — families likely to look elsewhere, expect single-tenant / working-renter base with shorter leases; only 12% free/reduced lunch — higher-income household profile.
- Zoned schools: Ellis School (math 28% / reading 43%, grade F, #177 of 263 statewide, top 67%, 375 students, 12% FRL) — zoned schools at 12% FRL track the district average.
- Market conditions: 16 active listings in the ZIP; 1 comparable units currently listed for rent nearby; 1,276 units permitted in Rockingham County in 2024 (593 in 5+ unit buildings).
Forward outlook
- Local home prices are declining (-3.0%/yr); year-one equity from $2k of loan paydown is wiped out by about $8k of value loss. Plan a longer hold.
Negotiation context
- It's been on market 23 days — a 2% lower offer ($256k) is reasonable based on typical stale-listing flexibility.
- 4 sale attempts since 12y ago with the ask held roughly flat each time — persistent listings suggest the price (not the market) is what's stuck; bring a comps-based counter.
- Current owner paid $128k; list at $260k implies a 103% gain — meaningful room to come down on a strong offer.
Risks & watch-outs
- Watch-outs: HOA is 21% of rent.
- Climate carrying-cost: major flood risk; major wind risk, 27% chance of damaging wind over 30y — expect insurance premiums to compound above CPI over the hold.
Questions for the listing agent
- What do current leases actually rent for vs. the listed asking? Can we see a recent rent roll and the last 12 months of T-12 income?
- What does the HOA fee cover, when was the last increase, and are there any pending special assessments or reserve-fund shortfalls?
- Is there a deadline driving the sale (1031 exchange, divorce, estate, relocation)? That informs how much negotiation room exists.
- The area grade is low — what's the realistic commute time and amenity access for the typical tenant pool here? Any planned neighborhood developments (good or bad) we should know about?
- What's the average days-on-market for RENTAL listings here right now (not sales)? A rising rental-DOM trend means longer vacancies and softer asking-rent achievability than the comps imply.
- What's the recent tenant-quality profile in this submarket — average credit score on applications, eviction rate, late-payment / NSF rate, and stable-employment percentage? A property-management company in the area should have these aggregated.
- How much new for-sale + rental construction is in the pipeline within 1–3 miles? Heavy new supply typically softens prices + rents 12–24 months out; constrained supply supports both.
Investment metrics
- 1% rule
- 1.15% ✓
- Cap rate
- 6.07%
- Cash-on-cash
- -0.80%
- DSCR
- 0.96
- GRM
- 7.2
CMA / ARV
- ARV (on-the-fly)
- $311,688
- Comps found
- 12
Show comp detail 12 sales within ~0.75 mi
| Address | Dist | Beds/Ba | Sqft | Sold | Price | $/sf | Match |
|---|---|---|---|---|---|---|---|
| 38 Tarah Way | 0.14mi | 2/2.0 (-1) | 1,408 (+0%) | 1mo | $350,000 | $249 | 87 |
| 32 Country Ln | 0.09mi | 2/2.0 (-1) | 1,404 (0%) | 8mo | $258,000 | $184 | 84 |
| 4-2 Georges Ln | 0.17mi | 3/2.0 | 1,512 (+8%) | 15mo | $249,900 | $165 | 67 |
| 7 Sharon Way #43 | 0.26mi | 2/2.0 (-1) | 1,440 (+3%) | 16mo | $344,900 | $240 | 66 |
| 6 Joyce Ln | 0.65mi | 3/2.0 | 1,404 (0%) | 8mo | $230,000 | $164 | 63 |
| 8 Cammett Dr | 0.62mi | 3/2.0 | 1,404 (0%) | 12mo | $260,000 | $185 | 61 |
| 7 Welch Ln | 0.54mi | 3/2.0 | 1,440 (+3%) | 11mo | $320,000 | $222 | 61 |
| 6 Sharon Way #42 | 0.26mi | 2/2.0 (-1) | 1,493 (+6%) | 18mo | $353,000 | $236 | 57 |
| 10 Sharon Way #46 | 0.29mi | 2/2.0 (-1) | 1,493 (+6%) | 20mo | $399,000 | $267 | 55 |
| 29 Sharon Way #55 | 0.39mi | 2/2.0 (-1) | 1,493 (+6%) | 14mo | $370,000 | $248 | 54 |
| 6 Mildred Ave | 0.70mi | 4/1.0 (+1) | 1,447 (+3%) | 8mo | $275,000 | $190 | 46 |
| 9 Cammett Dr | 0.60mi | 3/2.0 | 1,512 (+8%) | 19mo | $279,900 | $185 | 43 |
Match score weights: distance 35% · size 25% · config 20% · recency 20%. Top-matched comps best support the ARV.
Projected returns pro-forma
-3.0% appreciation · 3.0% rent growth · sell at horizon
- IRR
- -17.4%
- Equity multiple
- 0.38×
- Total profit
- $-44,765
- Equity at exit
- $38,752
- IRR
- -9.1%
- Equity multiple
- 0.43×
- Total profit
- $-41,206
- Equity at exit
- $22,471
Cash invested: $72,772 (down + closing). Projections, not guarantees.
Landlord ↔ Tenant lean methodology
- Overall (STATE)
- 56 Moderately Landlord-Leaning
- State New Hampshire
- 56 Moderately Landlord-Leaning · D+1
- County
- — inherits STATE
- City
- — inherits STATE
ZIP-level market 03044
- Home prices YoY
- -18.0%
- Active inventory
- 16
- Price-to-rent
- 7.2×
Monthly cashflow live
- Estimated rent
- $3,000 medium interval (Pro) →
- Mortgage (P&I)
- −$1,363
- Tax from tax record
- −$317 /mo · $3,805/yr
- Insurance
- −$108
- HOA
- −$630
- Vacancy / Maint / Mgmt
- −$630
- Net cashflow
- $-48
Break-even live
Sensitivity live
| Price | -10% $99 | -5% $25 | +0% $-48 | +5% $-122 | +10% $-195 |
|---|---|---|---|---|---|
| Rent | -10% $-285 | -5% $-167 | +0% $-48 | +5% $70 | +10% $189 |
| Rate | -1.0pp $83 | -0.5pp $18 | base $-48 | +0.5pp $-116 | +1.0pp $-184 |
UW: 25.0% down · 7.5% · 30yr · 1.5% tax · 5.0% vac · 8.0% maint · 8.0% mgmt
Financing live
Cash to close
- Down payment
- $64,975
- Closing costs
- $7,797
- Reserves months
- —
- Total cash needed
- —
Loan-product check · same deal, 3 products live
Conventional
25% down · 7.5% · 30yr
- Down + closing
- —
- Monthly P&I
- —
- Monthly cashflow
- —
- DSCR
- —
- Eligible?
- —
Personal DTI + credit; lowest rate.
DSCR
20% down · 8.5% · 30yr
- Down + closing
- —
- Monthly P&I
- —
- Monthly cashflow
- —
- DSCR
- —
- Eligible?
- —
No personal income docs; deal must DSCR.
Hard money
10% down · 12.0% · 12mo
- Down + closing
- —
- Monthly P&I
- —
- Monthly cashflow
- —
- DSCR
- —
- Eligible?
- —
Short-term bridge; refi at stabilization.
Rent comps 1 comps
| Address | Beds | Baths | Sqft | Rent | $/sqft | DOM | Units | Dist |
|---|---|---|---|---|---|---|---|---|
| 144 Main St Unit 3 Fremont, NH | 3.0 | 1.5 | 1550 | $3,000 | $1.94 | 0d | 1 | 0.48mi |
HOA detail
- Monthly dues
- $630 · $7,560/yr
- Likely covers
- electriclandscaping
Listing history 14 events
-
2026-06-21days on market $259,900 Active 23 DOM
-
2026-06-18days on market $259,900 Active 20 DOM
-
2026-06-17statusdays on market $259,900 Active 19 DOM
-
2026-06-16days on market $259,900 Active with Contract 18 DOM
-
2026-06-15days on market $259,900 Active with Contract 17 DOM
-
2026-06-13days on market $259,900 Active with Contract 15 DOM
-
2026-06-09days on market $259,900 Active with Contract 11 DOM
-
2026-06-08days on market $259,900 Active with Contract 10 DOM
-
2026-06-07statusdays on market $259,900 Active with Contract 9 DOM
-
2026-06-04days on market $259,900 Active 6 DOM
-
2026-06-03days on market $259,900 Active 5 DOM
-
2026-06-02days on market $259,900 Active 4 DOM
-
2026-06-01days on market $259,900 Active 3 DOM
-
2026-05-31days on market $259,900 Active 2 DOM
ⓘ Source: listings_history table (triggers on properties + properties_extension) + one-shot
backfill from property_details.listing_events for pre-trigger history.
Tax reassessment forecast NH · Partial reset (capped growth)
- Current annual tax
- $3,805 · $317/mo
- Projected year-2 tax
- $4,735 · $395/mo
- Expected delta
- +$930/yr (+$78/mo · 24.5%)
ⓘ Screening estimate from a state-policy table — verify with the county assessor before closing.
Climate risk First Street
- Flood 6/10 Major FEMA zone X (unshaded) · 70% chance over 30 yrs
- Wildfire 3/10 Moderate
- Heat 4/10 Moderate 7 d/yr ≥96°F today · 15 d/yr by 30 yrs out
- Wind 6/10 Major 27% chance of damaging wind over 30 yrs
- Air quality 2/10 Low 2 unhealthy d/yr today · 2 by 30 yrs out
Nearby sold comps map
Loading sold comps map…
Walkable amenities ~0.75 mi
Loading nearby amenities…
Taxation est. · year 1
- Rental income
- $36,000
- − Mortgage interest
- −$14,558
- − Property taxes
- −$3,805
- − Insurance
- −$1,300
- − Repairs & maintenance
- −$2,880
- − Management
- −$2,880
- − HOA
- −$7,560
- − Depreciation
- −$7,561
- Taxable loss
- −$4,544
- Est. tax savings @ 24.0%
- +$1,090
- After-tax cash flow
- $511/yr
For passive investors: Depreciation is non-cash, so a rental often shows a tax loss while cash-flowing — sheltering income. Rental losses are passive: they offset passive income freely, and up to $25,000/yr can offset ordinary (W-2) income if you actively participate and your MAGI is under $100k (phasing out to $0 by $150k); unused losses carry forward. On sale, claimed depreciation is recaptured at up to 25%, and gains may owe capital-gains tax (a 1031 exchange can defer both). Figures are a year-1 estimate at your 24.0% rate — not tax advice; consult a CPA.
Schools (NCES district)
- District
- Fremont School District
- NCES district ID
- 3303150
- Math proficiency
- 28% ▼ -8.00%
- Reading proficiency
- 43% ▼ -10.00%
- Median HH income
- $83,728
- Composite
- 33.93/100
- National rank
- #5337
- State rank
- #67 of 98 in NH
Livability — Raymond
- Score
- 67/100
- State rank
- #63
- US rank
- #10832
Category grades
Schools grade is shown separately in the Schools card above.
Census & demographics
- Population (ZIP)
- 4,783
Population outlook (Rockingham County) Hauer SSP2
- Today (2025)
- 316,118 people
- By 2030
- 320,929 · +1.5%
- By 2040
- 323,358 · +2.3%
- By 2050
- 314,977 · -0.4%
- By 2075
- 297,686 · -5.8%
- By 2100
- 256,363 · -18.9%
Race, ethnicity, and origin ACS 2023
- Neighborhood character
- Predominantly White (92%)
- Race & ethnicity
- White 92% Two or more races 5% Hispanic / Latino 2%
- Common ancestry
- Lithuanian 17% Romanian 5% Slovak 4%
- Foreign-born
- 4% · Canada, China
- Languages at home
- 97% English-only · Chinese 1% Other Indo-European 1% Spanish 1%
Political lean MEDSL · Rockingham
- 2024 margin
- Toss-up / Even · D 48.3% · R 50.8%
- 2008→2024 swing
- -3.5pp toward R · 2008: 1.1pp · 2024: -2.4pp
- All cycles
- 2024: R+2.4 2020: D+2.1 2016: R+5.8 2012: R+4.5 2008: D+1.1
Not yet ingested
- Civics
- —
Market trends
- HPI YoY
- ▼ -67.29%
- Current HPI
- 307.2417
- Rent YoY
- —
- Metro
- —
- State GDP YoY
- —
- F500 in state
- 0
Price history
+161.2% since first listed9 events — show timeline
- 2026-05-29 Listed $259,900 PrimeMLS
- 2019-12-18 Sold (Public Records) $128,333 Public Records
- 2019-12-16 Sold (MLS) $128,300 PrimeMLS
- 2019-10-31 Contingent — PrimeMLS
- 2019-10-26 Listed $134,000 PrimeMLS
- 2014-08-25 Sold (MLS) $91,500 PrimeMLS
- 2014-08-25 Sold (MLS) $91,500 PrimeMLS
- 2014-06-18 Listed $99,500 PrimeMLS
- 2014-05-05 Listed $99,500 PrimeMLS
Property tax history
+5.0%/yrLatest (2025): $3,805 · +30.1% YoY. Source: county tax records.
Cash-flow waterfall
monthlySold comps — $/sqft
last 12 mo · ≤1 miLoading sold comps…