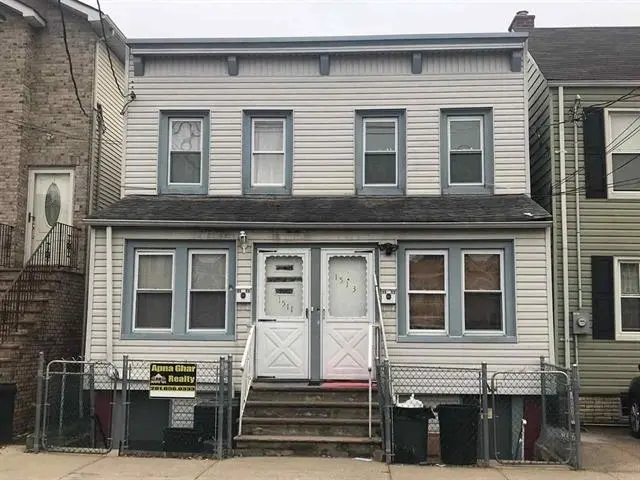
1511-1513 48TH St
Union City, NJ 07047
$900,000F
9 bd · 3.9 ba ·
2,172 sqft ·
Built 1916
· SingleFamily
· Active
· 23 DOM
Cashflow @ list (25.0% down · 7.5%)
Estimated rent
$4,196/mo
Mortgage (P&I)
−$4,720
Tax + insurance
−$1,253
HOA
−$0
Vac / Maint / Mgmt
−$881
Net cashflow
$-2,658/mo
Annual
$-31,891/yr
Cap rate
2.75%
Cash-on-cash
-12.66%
DSCR
0.44
1% rule
0.47%
Cash to close
$252,000
Investor read
- This is a 9-bed/3.9-bath single-family listed at $900k.
- At list price, monthly cash flow is $-3k ($-32k/yr) — negative.
- To cash-flow at today's rent, offer at most $431k (52.2% below list).
- To meet the 1% rule (rent ≥ 1% of price), the offer needs to be $420k (53.4% below list).
- It's been on market 23 days — a 2% lower offer ($886k) is reasonable based on typical stale-listing flexibility.
- Recommended offer: $420k (53.4% below list) — sets the bar for 1% rule.
- Local home prices are declining (-3.0%/yr); year-one equity from $6k of loan paydown is wiped out by about $27k of value loss. Plan a longer hold.
- Location reads 77/100 on livability (#117 in NJ, #2,998 nationally) — a middle-class / working-renter tenant base. Strengths: amenities A+, commute A+, health & safety A; Watch: cost of living F.
- North Bergen School District (suburban): math 12% / reading 37% proficiency, ranked #393 of 472 in NJ (top 83%) — low school quality limits family demand, transient renter base, plan for 1-2y turnover.
- Watch-outs: built in 1916 — expect roof / HVAC / electrical / plumbing capex.
- Market conditions: Rents rising fast (+5.0%/yr); 209 active listings in the ZIP; solid renter incomes; 5,310 units permitted in Hudson County in 2024 (4,154 in 5+ unit buildings).
- Hudson County population projected at +29% by 2050 — long-run rental-demand tailwind backs the buy-and-hold thesis.
- 2 sale attempts since 7y ago with the ask held roughly flat each time — persistent listings suggest the price (not the market) is what's stuck; bring a comps-based counter.
- Current owner paid $399k; list at $900k implies a 126% gain — meaningful room to come down on a strong offer.
- Climate carrying-cost: major wind risk, 27% chance of damaging wind over 30y; extreme-heat days projected 7→15/yr by 2055 (HVAC capex compounding) — expect insurance premiums to compound above CPI over the hold.
- Cap rate 2.7% vs local median 2.3% in Union City — meaningfully above typical; check what's discounted (condition, days-on-market, listing class) to confirm the premium yield is real.
- At $4,196/mo this rent would consume 64% of the median local household income ($79k/yr) (locally 3908% of renters already pay >50% of income on rent) — very limited rent-growth headroom before tenants either downsize or default.
Questions for listing agent
- What do current leases actually rent for vs. the listed asking? Can we see a recent rent roll and the last 12 months of T-12 income?
- Built in 1916 — when were the roof, HVAC, electrical panel, plumbing, and water heater last replaced?
- Is there a deadline driving the sale (1031 exchange, divorce, estate, relocation)? That informs how much negotiation room exists.
- The area grade is low — what's the realistic commute time and amenity access for the typical tenant pool here? Any planned neighborhood developments (good or bad) we should know about?
- What's the average days-on-market for RENTAL listings here right now (not sales)? A rising rental-DOM trend means longer vacancies and softer asking-rent achievability than the comps imply.
- What's the recent tenant-quality profile in this submarket — average credit score on applications, eviction rate, late-payment / NSF rate, and stable-employment percentage? A property-management company in the area should have these aggregated.
- How much new for-sale + rental construction is in the pipeline within 1–3 miles? Heavy new supply typically softens prices + rents 12–24 months out; constrained supply supports both.
CashFlowRE · CFR-VM08DRCZ0Q7KNB
· Data 2 days ago
cashflowre.app · 2026-05-29