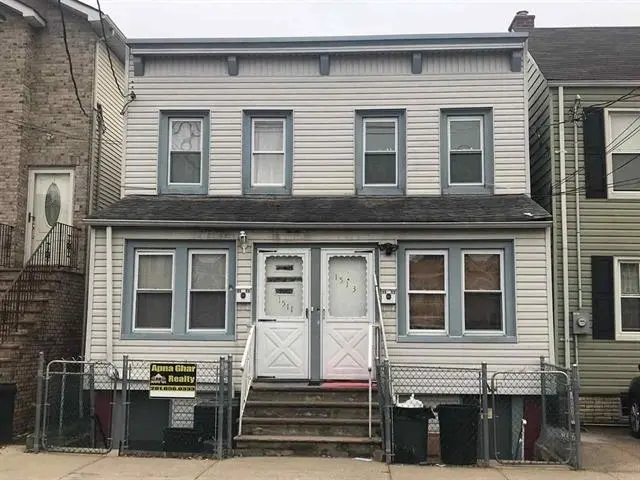
1511-1513 48TH St · Union City, NJ
Flood risk 4/10 · Minor
- FEMA flood zone
- X (unshaded)
- Chance of flooding over 30 yrs
- 0.24%
- Est. flood insurance / yr
- $507 – $1,088
Fire risk 1/10 · Minimal
- Est. fire insurance / yr
- $526 – $976
Heat risk 7/10 · Major
- Hot days now (above 98°F)
- 7 days/yr
- Hot days in 30 yrs
- 15 days/yr
Wind risk 6/10 · Moderate
- Chance of severe wind over 30 yrs
- 27.0%
Air-quality risk 4/10 · Minor
- Unhealthy air days now
- 5 days/yr
- Unhealthy air days in 30 yrs
- 6 days/yr
Risk factors via First Street. Map © Google.
Why this score? — see what drove the F grade
The composite is a weighted blend of 9 inputs, each scored 0–100. Each bar is that input's sub-score; the figure is the points it added to the 100-point composite (weight × sub-score).
- ARV discount +7.5/15.0
- Livability +3.9/5.0
- Cash flow +3.7/30.0
- Rent growth +3.7/5.0
- Condition / age +2.5/5.0
- Schools +2.2/10.0
- 1% rule +0.0/10.0
- DSCR +0.0/10.0
- Appreciation +0.0/10.0
$900,000
🖨 Deal sheet 📄 Offer letter ✓ Due diligence
Listing remarks
Location !!, Location !!. Location !!
Key facts
- Listed 23 days
Property features AI
Exterior
- Parking: No on-site parking
- Home design: Multifamily layout with two full levels
- Construction: Lead paint form present
- Exterior features: Aluminum/vinyl exterior finish
Interior
- Kitchen: Two kitchens total (one on each level); Oven; Stove
- Bedrooms: Four bedrooms on the first floor; Four bedrooms on the second floor
- Bathrooms: Four full bathrooms total (two full on the first floor, two full on the second floor)
- Heating & cooling: Window A/C; Baseboard heating
- Interior features: Finished full basement
Neighborhood map
What this means for you Summary
Snapshot
- This is a 9-bed/3.9-bath single-family listed at $900k.
Deal economics
- At list price, monthly cash flow is $-3k ($-32k/yr) — negative.
- To cash-flow at today's rent, offer at most $431k (52.2% below list).
- To meet the 1% rule (rent ≥ 1% of price), the offer needs to be $420k (53.4% below list).
- Recommended offer: $420k (53.4% below list) — sets the bar for 1% rule.
- Cap rate 2.7% vs local median 2.3% in Union City — meaningfully above typical; check what's discounted (condition, days-on-market, listing class) to confirm the premium yield is real.
Location & tenants
- Location reads 77/100 on livability (#117 in NJ, #2,998 nationally) — a middle-class / working-renter tenant base. Strengths: amenities A+, commute A+, health & safety A; Watch: cost of living F.
- North Bergen School District (suburban): math 12% / reading 37% proficiency, ranked #393 of 472 in NJ (top 83%) — low school quality limits family demand, transient renter base, plan for 1-2y turnover.
- Market conditions: Rents rising fast (+5.0%/yr); 209 active listings in the ZIP; solid renter incomes; 5,310 units permitted in Hudson County in 2024 (4,154 in 5+ unit buildings).
- At $4,196/mo this rent would consume 64% of the median local household income ($79k/yr) (locally 3908% of renters already pay >50% of income on rent) — very limited rent-growth headroom before tenants either downsize or default.
Forward outlook
- Local home prices are declining (-3.0%/yr); year-one equity from $6k of loan paydown is wiped out by about $27k of value loss. Plan a longer hold.
- Hudson County population projected at +29% by 2050 — long-run rental-demand tailwind backs the buy-and-hold thesis.
Negotiation context
- It's been on market 23 days — a 2% lower offer ($886k) is reasonable based on typical stale-listing flexibility.
- 2 sale attempts since 7y ago with the ask held roughly flat each time — persistent listings suggest the price (not the market) is what's stuck; bring a comps-based counter.
- Current owner paid $399k; list at $900k implies a 126% gain — meaningful room to come down on a strong offer.
Risks & watch-outs
- Watch-outs: built in 1916 — expect roof / HVAC / electrical / plumbing capex.
- Climate carrying-cost: major wind risk, 27% chance of damaging wind over 30y; extreme-heat days projected 7→15/yr by 2055 (HVAC capex compounding) — expect insurance premiums to compound above CPI over the hold.
Questions for the listing agent
- What do current leases actually rent for vs. the listed asking? Can we see a recent rent roll and the last 12 months of T-12 income?
- Built in 1916 — when were the roof, HVAC, electrical panel, plumbing, and water heater last replaced?
- Is there a deadline driving the sale (1031 exchange, divorce, estate, relocation)? That informs how much negotiation room exists.
- The area grade is low — what's the realistic commute time and amenity access for the typical tenant pool here? Any planned neighborhood developments (good or bad) we should know about?
- What's the average days-on-market for RENTAL listings here right now (not sales)? A rising rental-DOM trend means longer vacancies and softer asking-rent achievability than the comps imply.
- What's the recent tenant-quality profile in this submarket — average credit score on applications, eviction rate, late-payment / NSF rate, and stable-employment percentage? A property-management company in the area should have these aggregated.
- How much new for-sale + rental construction is in the pipeline within 1–3 miles? Heavy new supply typically softens prices + rents 12–24 months out; constrained supply supports both.
Investment metrics
- 1% rule
- 0.47% ✗
- Cap rate
- 2.75%
- Cash-on-cash
- -12.66%
- DSCR
- 0.44
- GRM
- 17.9
CMA / ARV
No comps found within radius.
Projected returns pro-forma
-3.0% appreciation · 4.99% rent growth · sell at horizon
- IRR
- -37.9%
- Equity multiple
- -0.22×
- Total profit
- $-306,623
- Equity at exit
- $134,193
- IRR
- -44.4%
- Equity multiple
- -0.78×
- Total profit
- $-448,695
- Equity at exit
- $77,816
Cash invested: $252,000 (down + closing). Projections, not guarantees.
Landlord ↔ Tenant lean methodology
- Overall (STATE)
- 21 Tenant-Leaning
- State New Jersey
- 21 Tenant-Leaning · D+6
- County
- — inherits STATE
- City
- — inherits STATE
ZIP-level market 07047
- Home prices YoY
- -31.5%
- Rents YoY
- 5.0%
- Active inventory
- 209
- Price-to-rent
- 17.9×
Monthly cashflow live
- Estimated rent
- $4,196 medium interval (Pro) →
- Mortgage (P&I)
- −$4,720
- Tax from tax record
- −$878 /mo · $10,537/yr
- Insurance
- −$375
- HOA
- −$0
- Vacancy / Maint / Mgmt
- −$881
- Net cashflow
- $-2,658
Break-even live
UW: 25.0% down · 7.5% · 30yr · 1.5% tax · 5.0% vac · 8.0% maint · 8.0% mgmt
Financing live
Cash to close
- Down payment
- $225,000
- Closing costs
- $27,000
- Reserves months
- —
- Total cash needed
- —
Loan-product check · same deal, 3 products live
Conventional
25% down · 7.5% · 30yr
- Down + closing
- —
- Monthly P&I
- —
- Monthly cashflow
- —
- DSCR
- —
- Eligible?
- —
Personal DTI + credit; lowest rate.
DSCR
20% down · 8.5% · 30yr
- Down + closing
- —
- Monthly P&I
- —
- Monthly cashflow
- —
- DSCR
- —
- Eligible?
- —
No personal income docs; deal must DSCR.
Hard money
10% down · 12.0% · 12mo
- Down + closing
- —
- Monthly P&I
- —
- Monthly cashflow
- —
- DSCR
- —
- Eligible?
- —
Short-term bridge; refi at stabilization.
Listing history 7 events
-
2026-06-18days on market $900,000 Active 23 DOM
-
2026-06-17days on market $900,000 Active 22 DOM
-
2026-06-16days on market $900,000 Active 21 DOM
-
2026-06-15days on market $900,000 Active 20 DOM
-
2026-06-13days on market $900,000 Active 18 DOM
-
2026-06-10remarks 37-char remark
-
2026-06-10$900,000 Active 14 DOM
ⓘ Source: listings_history table (triggers on properties + properties_extension) + one-shot
backfill from property_details.listing_events for pre-trigger history.
Tax reassessment forecast NJ · Partial reset (capped growth)
- Current annual tax
- $10,537 · $878/mo
- Projected year-2 tax
- $16,473 · $1,373/mo
- Expected delta
- +$5,937/yr (+$495/mo · 56.3%)
ⓘ Screening estimate from a state-policy table — verify with the county assessor before closing.
Climate risk First Street
- Flood 4/10 Moderate FEMA zone X (unshaded) · 24% chance over 30 yrs
- Wildfire 1/10 Low
- Heat 7/10 Severe 7 d/yr ≥98°F today · 15 d/yr by 30 yrs out
- Wind 6/10 Major 27% chance of damaging wind over 30 yrs
- Air quality 4/10 Moderate 5 unhealthy d/yr today · 6 by 30 yrs out
Nearby sold comps map
Loading sold comps map…
Walkable amenities ~0.75 mi
Loading nearby amenities…
Taxation est. · year 1
- Rental income
- $50,356
- − Mortgage interest
- −$50,414
- − Property taxes
- −$10,537
- − Insurance
- −$4,500
- − Repairs & maintenance
- −$4,029
- − Management
- −$4,029
- − Depreciation
- −$26,182
- Taxable loss
- −$49,333
- Est. tax savings @ 24.0%
- +$11,840
- After-tax cash flow
- $-20,051/yr
For passive investors: Depreciation is non-cash, so a rental often shows a tax loss while cash-flowing — sheltering income. Rental losses are passive: they offset passive income freely, and up to $25,000/yr can offset ordinary (W-2) income if you actively participate and your MAGI is under $100k (phasing out to $0 by $150k); unused losses carry forward. On sale, claimed depreciation is recaptured at up to 25%, and gains may owe capital-gains tax (a 1031 exchange can defer both). Figures are a year-1 estimate at your 24.0% rate — not tax advice; consult a CPA.
Schools (NCES district)
- District
- North Bergen School District
- NCES district ID
- 3411460
- Math proficiency
- 12% ▼ -16.00%
- Reading proficiency
- 37% ▼ -10.00%
- Median HH income
- $54,275
- Composite
- 21.95/100
- National rank
- #8221
- State rank
- #393 of 472 in NJ
Livability — Union City
- Score
- 77/100
- State rank
- #117
- US rank
- #2998
Category grades
Schools grade is shown separately in the Schools card above.
Census & demographics
- County
- Hudson County · 718,323 people
- City population
- 66,463
- Metro
- New York-Newark-Jersey City, NY-NJ-PA
- Population (ZIP)
- 61,250
- Household income
- $78,911
- Rent vs Own
- Severe rent burden
- 3908.0
Population outlook (Hudson County) Hauer SSP2
- Today (2025)
- 771,834 people
- By 2030
- 818,028 · +6.0%
- By 2040
- 907,866 · +17.6%
- By 2050
- 994,480 · +28.8%
- By 2075
- 1,163,301 · +50.7%
- By 2100
- 1,254,703 · +62.6%
Race, ethnicity, and origin ACS 2023
- Neighborhood character
- Predominantly Hispanic (69%)
- Race & ethnicity
- Hispanic / Latino 69% Two or more races 26% White 20% Asian 7% Black 3% Native American 1%
- Hispanic origin (detail)
- Mexican 2% Puerto Rican 7% Cuban 11% Dominican 12%
- Common ancestry
- Romanian 1% Lithuanian 1%
- Foreign-born
- 50% · Canada, Jamaica, South Korea
- Languages at home
- 27% English-only · Spanish 61% Other Indo-European 4% Arabic 3%
Political lean MEDSL · Hudson
- 2024 margin
- Strong D (+28.1) · D 62.6% · R 34.6% · Other 2.8%
- 2008→2024 swing
- -18.7pp toward R · 2008: 46.7pp · 2024: 28.1pp
- All cycles
- 2024: D+28.1 2020: D+46.2 2016: D+51.8 2012: D+55.7 2008: D+46.7
Not yet ingested
- Civics
- —
Market trends
- HPI YoY
- ▼ -192.36%
- Current HPI
- 419.0283
- Rent YoY
- ▲ 4.99%
- Metro
- New York-Newark-Jersey City, NY-NJ-PA
- State GDP YoY
- ▲ 2.05%
- F500 in state
- 34
Industry mix (Fortune 500 HQ in NJ)
| Industry | F500 HQs | Revenue |
|---|---|---|
| Consumer Goods | 3 | $31B |
|
||
| Pharmaceuticals | 2 | $153B |
|
||
| Technology | 2 | $21B |
|
||
| Insurance | 2 | $20B |
|
||
| Healthcare | 2 | $19B |
|
||
| Financial Services | 1 | $70B |
|
||
Price history
+332.7% since first listed5 events — show timeline
- 2026-05-18 Listed $900,000 HCMLS
- 2021-06-24 Sold (Public Records) $399,000 Public Records
- 2020-06-01 Listing Removed — HCMLS
- 2019-11-21 Listed $569,000 HCMLS
- 2001-09-24 Sold (Public Records) $208,000 Public Records
Property tax history
+4.8%/yrLatest (2025): $10,537 · +4.6% YoY. Source: county tax records.
Cash-flow waterfall
monthlySold comps — $/sqft
last 12 mo · ≤1 miLoading sold comps…