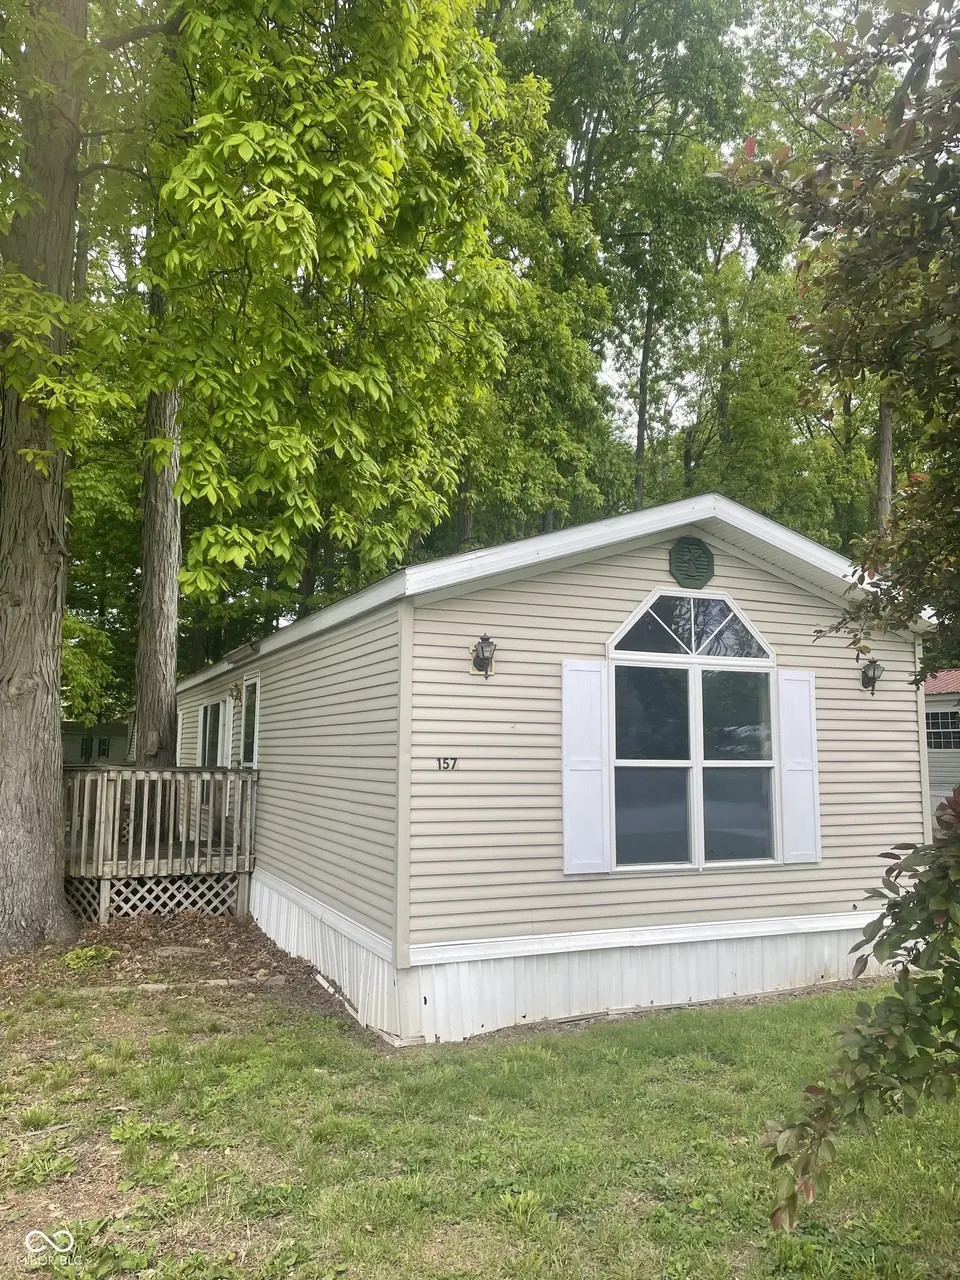
157 Lazy River Rd
Cloverdale, IN 46120
$130,000D
2 bd · 2.0 ba ·
1,216 sqft ·
Built 1995
· Manufactured
· Pending
· 3 DOM
Cashflow @ list (25.0% down · 7.5%)
Estimated rent
$1,041/mo
Mortgage (P&I)
−$682
Tax + insurance
−$207
HOA
−$0
Vac / Maint / Mgmt
−$219
Net cashflow
$-67/mo
Annual
$-801/yr
Cap rate
5.68%
Cash-on-cash
-2.20%
DSCR
0.90
1% rule
0.80%
Cash to close
$36,400
Investor read
- This is a 2-bed/2.0-bath manufactured listed at $130k.
- At list price, monthly cash flow is $-67 ($-801/yr) — negative.
- To cash-flow at today's rent, offer at most $118k (9.1% below list).
- To meet the 1% rule (rent ≥ 1% of price), the offer needs to be $104k (19.9% below list).
- Only 3 days on market — expect competitive offers; lowballing is unlikely to land.
- Recommended offer: $104k (19.9% below list) — sets the bar for 1% rule.
- Local home prices are declining (-1.2%/yr); year-one equity from $899 of loan paydown is wiped out by about $2k of value loss. Plan a longer hold.
- Location reads 70/100 on livability (#156 in IN) — a middle-class / working-renter tenant base. Strengths: crime A+, cost of living A+, housing A+; Watch: amenities F, commute F, health & safety F.
- Cloverdale Community Schools (rural): math 36% / reading 40% proficiency, ranked #167 of 301 in IN (top 56%) — families likely to look elsewhere, expect single-tenant / working-renter base with shorter leases.
- Zoned schools: Cloverdale Elementary School (math 42% / reading 37%, grade F, #500 of 994 statewide, top 53%, 424 students, 75% FRL); Cloverdale High School (math 37% / reading 62%, grade D, #123 of 369 statewide, top 36%, 279 students, 56% FRL) — zoned schools average 65% FRL vs 50% district-wide (16 pts higher); higher-poverty schools than district average — tighter screening recommended.
- Market conditions: 65 active listings in the ZIP; 166 units permitted in Putnam County in 2024 (0 in 5+ unit buildings).
- Putnam County population projected to shrink 8% by 2050 — rents likely to lag national; underwrite the cash flow, not the appreciation.
- 13 sale attempts since 8y ago with the ask held roughly flat each time — persistent listings suggest the price (not the market) is what's stuck; bring a comps-based counter.
- Current owner paid $28k; list at $130k implies a 373% gain — meaningful room to come down on a strong offer.
- Cap rate 5.7% vs local median 3.5% in Cloverdale — top-decile yield for the area; either an underpriced asset or a hidden risk that comps aren't pricing in. Stress-test before assuming the spread holds.
Questions for listing agent
- What do current leases actually rent for vs. the listed asking? Can we see a recent rent roll and the last 12 months of T-12 income?
- Is there a deadline driving the sale (1031 exchange, divorce, estate, relocation)? That informs how much negotiation room exists.
- The area grade is low — what's the realistic commute time and amenity access for the typical tenant pool here? Any planned neighborhood developments (good or bad) we should know about?
- What's the average days-on-market for RENTAL listings here right now (not sales)? A rising rental-DOM trend means longer vacancies and softer asking-rent achievability than the comps imply.
- What's the recent tenant-quality profile in this submarket — average credit score on applications, eviction rate, late-payment / NSF rate, and stable-employment percentage? A property-management company in the area should have these aggregated.
- How much new for-sale + rental construction is in the pipeline within 1–3 miles? Heavy new supply typically softens prices + rents 12–24 months out; constrained supply supports both.
CashFlowRE · CFR-VM1YYB4C58SS64
· Data 3 weeks ago
cashflowre.app · 2026-05-29