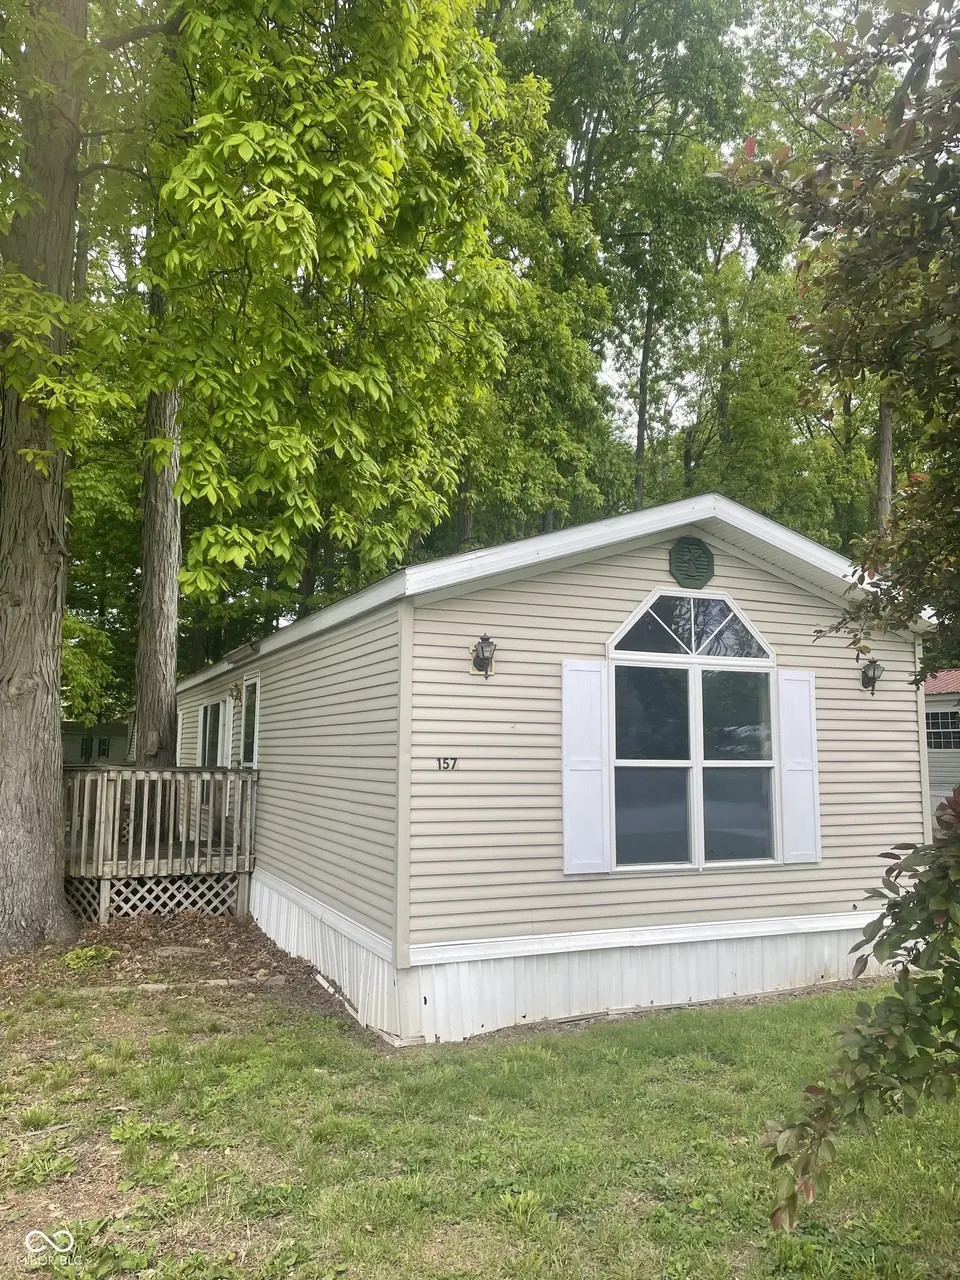
157 Lazy River Rd · Cloverdale, IN
Flood risk 1/10 · Minimal
- FEMA flood zone
- X (unshaded)
- Chance of flooding over 30 yrs
- 0.0%
- Est. flood insurance / yr
- $507 – $1,088
Fire risk 3/10 · Minor
- Est. fire insurance / yr
- $717 – $1,331
Heat risk 3/10 · Minor
- Hot days now (above 103°F)
- 7 days/yr
- Hot days in 30 yrs
- 18 days/yr
Wind risk 2/10 · Minimal
- Chance of severe wind over 30 yrs
- 1.0%
Air-quality risk 3/10 · Minor
- Unhealthy air days now
- 2 days/yr
- Unhealthy air days in 30 yrs
- 3 days/yr
Risk factors via First Street. Map © Google.
Why this score? — see what drove the D grade
The composite is a weighted blend of 9 inputs, each scored 0–100. Each bar is that input's sub-score; the figure is the points it added to the 100-point composite (weight × sub-score).
- ARV discount +11.7/15.0
- Cash flow +10.5/30.0
- Appreciation +4.4/10.0
- Livability +3.5/5.0
- Schools +3.2/10.0
- 1% rule +3.0/10.0
- DSCR +3.0/10.0
- Rent growth +2.5/5.0
- Condition / age +2.5/5.0
$130,000
🖨 Deal sheet 📄 Offer letter ✓ Due diligence
Listing remarks
Welcome to 157 Lazy River Road! This 2 bedroom, 2 bath home with a 2-car garage sits on a nice wooded lot in Stardust Hills, offering privacy and peaceful surroundings. Move-in ready with all appliances included, even the washer and dryer! The spacious primary suite features a walk-in closet and private en suite bath complete with a garden tub and separate shower. The second bedroom is generously sized and would make a great guest bedroom, home office, or flex space. New flooring throughout gives the home a fresh updated feel. The home also features a dedicated laundry room with washer and dryer included. Add your personal finishing touches and make this home your own. Enjoy community ameni
Key facts
- Wooded lot
- Walk-in closet
- Community amenities
Tags
Property features AI
Finance
- Other: Lot size approximately 0.17 acres
Exterior
- Parking: Detached 2-car garage
- Utilities: Public water; Municipal sewer
- Home design: Manufactured home; One level
- Construction: Vinyl siding; Other foundation
- Exterior features: Deck; Mature trees on the lot
Interior
- Kitchen: Electric cooktop; Dishwasher; Refrigerator
- Bedrooms: 2 bedrooms on the main level; Primary bedroom with walk-in closet
- Bathrooms: 2 full bathrooms; Primary bathroom suite with separate shower and garden tub
- Heating & cooling: Electric forced air heating; Central air conditioning
- Interior features: Eat-in kitchen; Walk-in closet(s)
- Laundry & utility: Washer; Dryer
Neighborhood map
What this means for you Summary
Snapshot
- This is a 2-bed/2.0-bath manufactured listed at $130k.
Deal economics
- At list price, monthly cash flow is $-67 ($-801/yr) — negative.
- To cash-flow at today's rent, offer at most $118k (9.1% below list).
- To meet the 1% rule (rent ≥ 1% of price), the offer needs to be $104k (19.9% below list).
- Recommended offer: $104k (19.9% below list) — sets the bar for 1% rule.
- Cap rate 5.7% vs local median 3.5% in Cloverdale — top-decile yield for the area; either an underpriced asset or a hidden risk that comps aren't pricing in. Stress-test before assuming the spread holds.
Location & tenants
- Location reads 70/100 on livability (#156 in IN) — a middle-class / working-renter tenant base. Strengths: crime A+, cost of living A+, housing A+; Watch: amenities F, commute F, health & safety F.
- Cloverdale Community Schools (rural): math 36% / reading 40% proficiency, ranked #167 of 301 in IN (top 56%) — families likely to look elsewhere, expect single-tenant / working-renter base with shorter leases.
- Zoned schools: Cloverdale Elementary School (math 42% / reading 37%, grade F, #500 of 994 statewide, top 53%, 424 students, 75% FRL); Cloverdale High School (math 37% / reading 62%, grade D, #123 of 369 statewide, top 36%, 279 students, 56% FRL) — zoned schools average 65% FRL vs 50% district-wide (16 pts higher); higher-poverty schools than district average — tighter screening recommended.
- Market conditions: 65 active listings in the ZIP; 166 units permitted in Putnam County in 2024 (0 in 5+ unit buildings).
Forward outlook
- Local home prices are declining (-1.2%/yr); year-one equity from $899 of loan paydown is wiped out by about $2k of value loss. Plan a longer hold.
- Putnam County population projected to shrink 8% by 2050 — rents likely to lag national; underwrite the cash flow, not the appreciation.
Negotiation context
- Only 3 days on market — expect competitive offers; lowballing is unlikely to land.
- 13 sale attempts since 8y ago with the ask held roughly flat each time — persistent listings suggest the price (not the market) is what's stuck; bring a comps-based counter.
- Current owner paid $28k; list at $130k implies a 373% gain — meaningful room to come down on a strong offer.
Questions for the listing agent
- What do current leases actually rent for vs. the listed asking? Can we see a recent rent roll and the last 12 months of T-12 income?
- Is there a deadline driving the sale (1031 exchange, divorce, estate, relocation)? That informs how much negotiation room exists.
- The area grade is low — what's the realistic commute time and amenity access for the typical tenant pool here? Any planned neighborhood developments (good or bad) we should know about?
- What's the average days-on-market for RENTAL listings here right now (not sales)? A rising rental-DOM trend means longer vacancies and softer asking-rent achievability than the comps imply.
- What's the recent tenant-quality profile in this submarket — average credit score on applications, eviction rate, late-payment / NSF rate, and stable-employment percentage? A property-management company in the area should have these aggregated.
- How much new for-sale + rental construction is in the pipeline within 1–3 miles? Heavy new supply typically softens prices + rents 12–24 months out; constrained supply supports both.
Investment metrics
- 1% rule
- 0.80% ✗
- Cap rate
- 5.68%
- Cash-on-cash
- -2.20%
- DSCR
- 0.90
- GRM
- 10.4
CMA / ARV
- ARV (on-the-fly)
- $143,488
- Comps found
- 12
Show comp detail 12 sales within ~0.75 mi
| Address | Dist | Beds/Ba | Sqft | Sold | Price | $/sf | Match |
|---|---|---|---|---|---|---|---|
| 157 Lazy River Rd | 0.00mi | 2/2.0 | 1,216 (0%) | 0mo | $130,000 | $107 | 100 |
| 125 Oriole Ct | 0.05mi | 3/1.0 (+1) | 1,216 (0%) | 2mo | $142,900 | $118 | 87 |
| 597 Lazy River Rd | 0.04mi | 3/2.0 (+1) | 1,188 (-2%) | 9mo | $165,000 | $139 | 82 |
| 94 Small Fry Ave | 0.32mi | 2/2.0 | 1,216 (0%) | 4mo | $125,000 | $103 | 82 |
| 384 Cool Evening Ct | 0.21mi | 3/2.0 (+1) | 1,232 (+1%) | 6mo | $92,000 | $75 | 77 |
| 179 Lazy River Ct | 0.12mi | 2/1.5 | 1,152 (-5%) | 11mo | $139,900 | $121 | 74 |
| 334 Small Fry Ave | 0.28mi | 3/2.0 (+1) | 1,188 (-2%) | 6mo | $172,900 | $146 | 73 |
| 289 Bubble Loo Rd | 0.36mi | 3/2.0 (+1) | 1,216 (0%) | 14mo | $157,000 | $129 | 67 |
| 261 Down Boy Way | 0.33mi | 2/2.0 | 1,104 (-9%) | 5mo | $142,000 | $129 | 65 |
| 362 Gentlemen Pl | 0.13mi | 3/2.0 (+1) | 1,140 (-6%) | 18mo | $102,600 | $90 | 64 |
| 443 Stardust Way | 0.42mi | 3/2.0 (+1) | 1,323 (+9%) | 15mo | $150,000 | $113 | 48 |
| 288 Bubble Loo Rd | 0.36mi | 3/2.0 (+1) | 1,064 (-12%) | 11mo | $79,900 | $75 | 48 |
Match score weights: distance 35% · size 25% · config 20% · recency 20%. Top-matched comps best support the ARV.
Projected returns pro-forma
-1.22% appreciation · 3.0% rent growth · sell at horizon
- IRR
- -9.9%
- Equity multiple
- 0.58×
- Total profit
- $-15,305
- Equity at exit
- $30,025
- IRR
- -2.9%
- Equity multiple
- 0.74×
- Total profit
- $-9,474
- Equity at exit
- $30,387
Cash invested: $36,400 (down + closing). Projections, not guarantees.
Landlord ↔ Tenant lean methodology
- Overall (STATE)
- 90 Strongly Landlord-Friendly
- State Indiana
- 90 Strongly Landlord-Friendly · R+11
- County
- — inherits STATE
- City
- — inherits STATE
ZIP-level market 46120
- Home prices YoY
- -0.5%
- Active inventory
- 65
- Price-to-rent
- 10.4×
Monthly cashflow live
- Estimated rent
- $1,041 medium interval (Pro) →
- Mortgage (P&I)
- −$682
- Tax from tax record
- −$153 /mo · $1,838/yr
- Insurance
- −$54
- HOA
- −$0
- Vacancy / Maint / Mgmt
- −$219
- Net cashflow
- $-67
Break-even live
UW: 25.0% down · 7.5% · 30yr · 1.5% tax · 5.0% vac · 8.0% maint · 8.0% mgmt
Financing live
Cash to close
- Down payment
- $32,500
- Closing costs
- $3,900
- Reserves months
- —
- Total cash needed
- —
Loan-product check · same deal, 3 products live
Conventional
25% down · 7.5% · 30yr
- Down + closing
- —
- Monthly P&I
- —
- Monthly cashflow
- —
- DSCR
- —
- Eligible?
- —
Personal DTI + credit; lowest rate.
DSCR
20% down · 8.5% · 30yr
- Down + closing
- —
- Monthly P&I
- —
- Monthly cashflow
- —
- DSCR
- —
- Eligible?
- —
No personal income docs; deal must DSCR.
Hard money
10% down · 12.0% · 12mo
- Down + closing
- —
- Monthly P&I
- —
- Monthly cashflow
- —
- DSCR
- —
- Eligible?
- —
Short-term bridge; refi at stabilization.
Listing history 22 events
-
2026-05-11status Pending
-
2026-05-08$130,000 Active
-
2025-12-09historical
-
2025-09-10$124,995 Active
-
2025-09-06historical
-
2025-08-23status Active
-
2025-08-23historical
-
2025-07-02$129,900 Active
-
2025-07-02status Active
-
2025-07-02status Active
-
2025-06-30historical
-
2025-04-03status Active
-
2025-04-03status Active
-
2025-04-03status Active
-
2025-03-31status Pending
-
2025-03-31status Pending
-
2025-03-31status Pending
-
2025-03-23$129,900 Active
-
2025-03-23$129,900 Active
-
2025-03-21$129,900 Active
-
2018-07-03soldstatus $27,500
-
2018-06-01$29,900
ⓘ Source: listings_history table (triggers on properties + properties_extension) + one-shot
backfill from property_details.listing_events for pre-trigger history.
Tax reassessment forecast IN · Partial reset (capped growth)
- Current annual tax
- $1,838 · $153/mo
- Projected year-2 tax
- $1,838 · $153/mo
- Expected delta
- $0/yr ($0/mo · 0.0%)
ⓘ Screening estimate from a state-policy table — verify with the county assessor before closing.
Climate risk First Street
- Flood 1/10 Low FEMA zone X (unshaded) · 0% chance over 30 yrs
- Wildfire 3/10 Moderate
- Heat 3/10 Moderate 7 d/yr ≥103°F today · 18 d/yr by 30 yrs out
- Wind 2/10 Low 100% chance of damaging wind over 30 yrs
- Air quality 3/10 Moderate 2 unhealthy d/yr today · 3 by 30 yrs out
Nearby sold comps map
Loading sold comps map…
Walkable amenities ~0.75 mi
Loading nearby amenities…
Taxation est. · year 1
- Rental income
- $12,490
- − Mortgage interest
- −$7,282
- − Property taxes
- −$1,838
- − Insurance
- −$650
- − Repairs & maintenance
- −$999
- − Management
- −$999
- − Depreciation
- −$3,782
- Taxable loss
- −$3,060
- Est. tax savings @ 24.0%
- +$734
- After-tax cash flow
- $-67/yr
For passive investors: Depreciation is non-cash, so a rental often shows a tax loss while cash-flowing — sheltering income. Rental losses are passive: they offset passive income freely, and up to $25,000/yr can offset ordinary (W-2) income if you actively participate and your MAGI is under $100k (phasing out to $0 by $150k); unused losses carry forward. On sale, claimed depreciation is recaptured at up to 25%, and gains may owe capital-gains tax (a 1031 exchange can defer both). Figures are a year-1 estimate at your 24.0% rate — not tax advice; consult a CPA.
Schools (NCES district)
- District
- Cloverdale Community Schools
- NCES district ID
- 1802220
- Math proficiency
- 36% ▼ -16.00%
- Reading proficiency
- 40% ▼ -14.00%
- Median HH income
- $44,267
- Composite
- 32.28/100
- National rank
- #5753
- State rank
- #167 of 301 in IN
Livability — Cloverdale
- Score
- 70/100
- State rank
- #156
- US rank
- #7715
Category grades
Schools grade is shown separately in the Schools card above.
Census & demographics
- Census place
- Cloverdale, IN
- City population
- 6,138
- Population (ZIP)
- 6,138
Population outlook (Putnam County) Hauer SSP2
- Today (2025)
- 37,226 people
- By 2030
- 36,723 · -1.4%
- By 2040
- 35,407 · -4.9%
- By 2050
- 34,177 · -8.2%
- By 2075
- 32,038 · -13.9%
- By 2100
- 28,380 · -23.8%
Race, ethnicity, and origin ACS 2023
- Neighborhood character
- Predominantly White (97%)
- Race & ethnicity
- White 97% Two or more races 1% Black 1%
- Common ancestry
- Slovak 3% Lithuanian 2% Iranian 2%
- Foreign-born
- 1%
- Languages at home
- 99% English-only · Spanish 1%
Political lean MEDSL · Putnam
- 2024 margin
- Solid R (+52.0) · D 23.1% · R 75.1% · Other 1.8%
- 2008→2024 swing
- -40.0pp toward R · 2008: -12.0pp · 2024: -52.0pp
- All cycles
- 2024: R+52.0 2020: R+50.2 2016: R+49.6 2012: R+32.6 2008: R+12.0
Not yet ingested
- Civics
- —
Market trends
- HPI YoY
- ▼ -1.22%
- Current HPI
- 235.6828
- Rent YoY
- —
- Metro
- —
- State GDP YoY
- ▲ 2.90%
- F500 in state
- 18
Industry mix (Fortune 500 HQ in IN)
| Industry | F500 HQs | Revenue |
|---|---|---|
| Industrial Machinery | 2 | $37B |
|
||
| Healthcare | 1 | $177B |
|
||
| Pharmaceuticals | 1 | $45B |
|
||
| Metals / Steel | 1 | $18B |
|
||
| Agriculture | 1 | $17B |
|
||
| Packaging | 1 | $12B |
|
||
Price history
+334.8% since first listed22 events — show timeline
- 2026-05-11 Pending — MIBOR as Distributed by MLS Grid
- 2026-05-08 Listed $130,000 MIBOR as Distributed by MLS Grid
- 2025-12-09 Listing Removed — MIBOR as Distributed by MLS Grid
- 2025-09-10 Listed $124,995 MIBOR as Distributed by MLS Grid
- 2025-09-06 Listing Removed — MIBOR as Distributed by MLS Grid
- 2025-08-23 Relisted — IRMLS
- 2025-08-23 Delisted — IRMLS
- 2025-07-02 Listed $129,900 THAAR
- 2025-07-02 Relisted — IRMLS
- 2025-07-02 Relisted — MIBOR as Distributed by MLS Grid
- 2025-06-30 Listing Removed — MIBOR as Distributed by MLS Grid
- 2025-04-03 Relisted — THAAR
- 2025-04-03 Relisted — IRMLS
- 2025-04-03 Relisted — MIBOR as Distributed by MLS Grid
- 2025-03-31 Pending — THAAR
- 2025-03-31 Pending — IRMLS
- 2025-03-31 Pending — MIBOR as Distributed by MLS Grid
- 2025-03-23 Listed $129,900 THAAR
- 2025-03-23 Listed $129,900 IRMLS
- 2025-03-21 Listed $129,900 MIBOR as Distributed by MLS Grid
- 2018-07-03 Sold (MLS) $27,500 MIBOR as Distributed by MLS Grid
- 2018-06-01 Listed $29,900 MIBOR as Distributed by MLS Grid
Property tax history
+19.8%/yrLatest (2024): $1,838 · +115.7% YoY. Source: county tax records.
Cash-flow waterfall
monthlySold comps — $/sqft
last 12 mo · ≤1 miLoading sold comps…