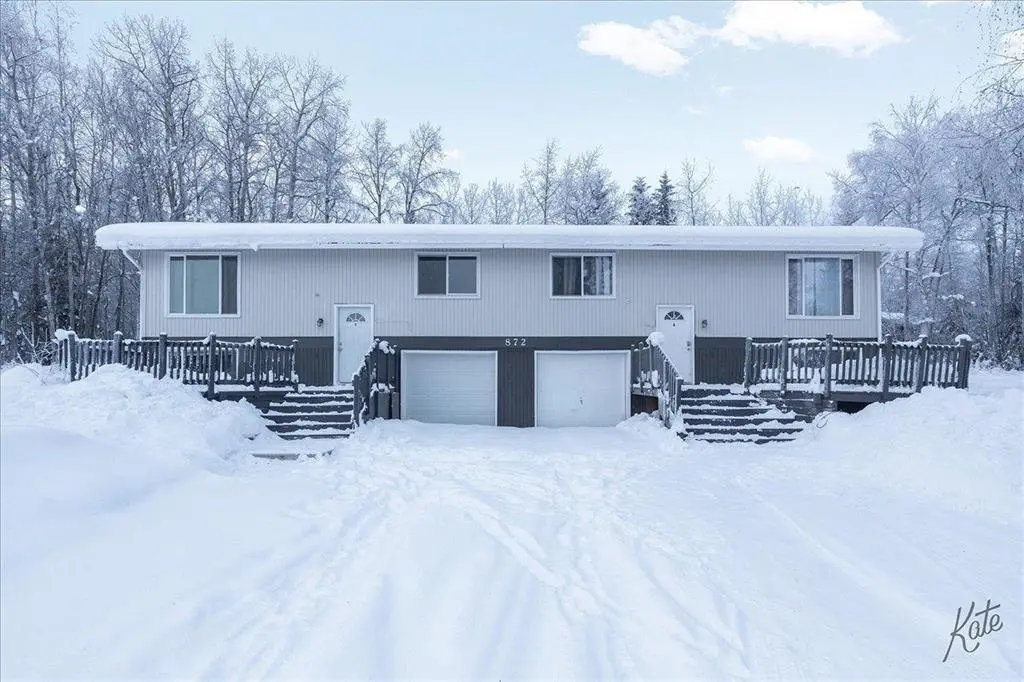
872 Ridge Loop Rd
Badger, AK 99705
$389,900B
6 bd · 2.0 ba ·
2,544 sqft ·
Built 1975
· MultiFamily
· Active
· 20 DOM
Cashflow @ list (25.0% down · 7.5%)
Estimated rent
$4,617/mo
Mortgage (P&I)
−$2,045
Tax + insurance
−$529
HOA
−$0
Vac / Maint / Mgmt
−$970
Net cashflow
$1,073/mo
Annual
$12,880/yr
Cap rate
9.60%
Cash-on-cash
11.80%
DSCR
1.52
1% rule
1.18%
Cash to close
$109,172
Investor read
- This is a 2 × 3-bed/1.0-bath units multifamily listed at $390k.
- At list price, monthly cash flow is $1k ($13k/yr) — positive. Per door: $537/mo.
- The deal already cash-flows at list — no discount required.
- Meets the 1% rule at list price ($5k rent vs $390k).
- It's been on market 20 days — a 2% lower offer ($384k) is reasonable based on typical stale-listing flexibility.
- Recommended offer: $384k (1.5% below list) — sets the bar for market timing.
- Local home prices are declining (-3.0%/yr); year-one equity from $3k of loan paydown is wiped out by about $12k of value loss. Plan a longer hold.
- Location reads 63/100 on livability (#49 in AK) — a middle-class / working-renter tenant base. Strengths: employment A+, housing A+; Watch: cost of living C-, schools D, crime F.
- Fairbanks North Star Borough School District (urban): math 33% / reading 45% proficiency, ranked #10 of 21 in AK (top 48%) — families likely to look elsewhere, expect single-tenant / working-renter base with shorter leases.
- Market conditions: Rents rising fast (+5.1%/yr); 248 active listings in the ZIP; solid renter incomes; 1 units permitted in Fairbanks North Star Borough in 2024 (0 in 5+ unit buildings).
- Fairbanks North Star County population projected at +6% by 2050 — modest demand growth; plan on rents tracking national, not racing it.
- 6 sale attempts since 5y ago; this cycle's ask is 8% above the opening price — seller raised mid-cycle; expect resistance to lowballs.
- At projected returns (-3.0% appreciation + 5.1% rent growth), your $109k cash investment doubles in ~8 years — after that, you're playing with house money.
- Cap rate 9.6% vs local median 4.9% in Badger — top-decile yield for the area; either an underpriced asset or a hidden risk that comps aren't pricing in. Stress-test before assuming the spread holds.
- At $4,617/mo this rent would consume 57% of the median local household income ($97k/yr) (locally 237% of renters already pay >50% of income on rent) — very limited rent-growth headroom before tenants either downsize or default.
Questions for listing agent
- Can we see the unit-by-unit rent roll, current vacancy, and any below-market leases? What's the average tenancy length?
- What capital expenditures (roof, boiler, parking lot, exteriors) have been made in the last 5 years, and what's planned in the next 2?
- Built in 1975 — when were the roof, HVAC, electrical panel, plumbing, and water heater last replaced?
- Is there a deadline driving the sale (1031 exchange, divorce, estate, relocation)? That informs how much negotiation room exists.
- Schools are D-rated, which usually means shorter tenancies and higher turnover. Who's the typical renter profile here, and what's been the actual vacancy rate?
- Crime grade is F in this area — have there been break-ins, vandalism, or insurance claims at this property in the last 3 years? What carrier currently insures it and at what premium?
- What's the average days-on-market for RENTAL listings here right now (not sales)? A rising rental-DOM trend means longer vacancies and softer asking-rent achievability than the comps imply.
- What's the recent tenant-quality profile in this submarket — average credit score on applications, eviction rate, late-payment / NSF rate, and stable-employment percentage? A property-management company in the area should have these aggregated.
CashFlowRE · CFR-VMN2467FQXJ7PT
· Data 2 weeks ago
cashflowre.app · 2026-05-29