 Duplex
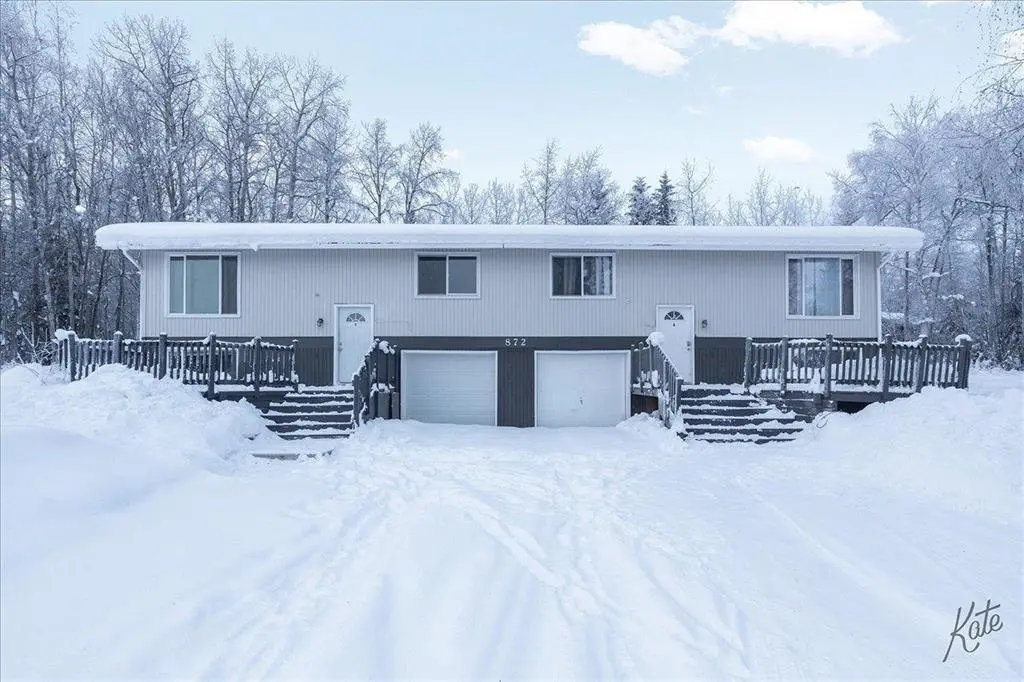
872 Ridge Loop Rd · Badger, AK
Flood risk 1/10 · Minimal
- FEMA flood zone
- X (unshaded)
- Chance of flooding over 30 yrs
- 0.0%
- Est. flood insurance / yr
- $473 – $860
Fire risk No data
- Est. fire insurance / yr
- —
Heat risk No data
- Hot days now (above threshold)
- —
- Hot days in 30 yrs
- —
Wind risk No data
- Chance of severe wind over 30 yrs
- —
Air-quality risk 1/10 · Minimal
- Unhealthy air days now
- —
- Unhealthy air days in 30 yrs
- —
Risk factors via First Street. Map © Google.
Why this score? — see what drove the B grade
The composite is a weighted blend of 9 inputs, each scored 0–100. Each bar is that input's sub-score; the figure is the points it added to the 100-point composite (weight × sub-score).
- Cash flow +26.8/30.0
- ARV discount +15.0/15.0
- DSCR +9.2/10.0
- 1% rule +6.8/10.0
- Rent growth +3.8/5.0
- Schools +3.6/10.0
- Livability +3.2/5.0
- Condition / age +2.5/5.0
- Appreciation +0.0/10.0
$389,900
🖨 Deal sheet 📄 Offer letter ✓ Due diligence
Multi-family units
County records classify this as Multi-Family (2-4 Unit). Listing-text estimate: 2 units. confirmed
Listing remarks
Well-located duplex on Lakloey Hill, just minutes from Ft. Wainwright’s back gate. This property offers a strong opportunity for an owner-occupant, investor, or buyer looking to build equity in a desirable rental location. Live in one unit and rent the other, or add it to your long-term investment portfolio. Each side features 3 bedrooms, 1 full bathroom, a 1-car garage, and separate washer/dryer hookups, giving both units a practical and functional layout. The south-facing yard provides excellent natural light and usable outdoor space, and the property is connected to Valley Water, so there is no water hauling required. One unit is currently owner-occupied, and the other is available
Key facts
- South-facing yard
- 0.73 acre lot
- 2 garage spots
Tags
Neighborhood map
What this means for you Summary
Snapshot
- This is a 2 × 3-bed/1.0-bath units multifamily listed at $390k.
Deal economics
- At list price, monthly cash flow is $1k ($13k/yr) — positive. Per door: $537/mo.
- The deal already cash-flows at list — no discount required.
- Meets the 1% rule at list price ($5k rent vs $390k).
- Recommended offer: $384k (1.5% below list) — sets the bar for market timing.
- Cap rate 9.6% vs local median 4.9% in Badger — top-decile yield for the area; either an underpriced asset or a hidden risk that comps aren't pricing in. Stress-test before assuming the spread holds.
Location & tenants
- Location reads 63/100 on livability (#49 in AK) — a middle-class / working-renter tenant base. Strengths: employment A+, housing A+; Watch: cost of living C-, schools D, crime F.
- Fairbanks North Star Borough School District (urban): math 33% / reading 45% proficiency, ranked #10 of 21 in AK (top 48%) — families likely to look elsewhere, expect single-tenant / working-renter base with shorter leases.
- Market conditions: Rents rising fast (+5.1%/yr); 248 active listings in the ZIP; solid renter incomes; 1 units permitted in Fairbanks North Star Borough in 2024 (0 in 5+ unit buildings).
- At $4,617/mo this rent would consume 57% of the median local household income ($97k/yr) (locally 237% of renters already pay >50% of income on rent) — very limited rent-growth headroom before tenants either downsize or default.
Forward outlook
- Local home prices are declining (-3.0%/yr); year-one equity from $3k of loan paydown is wiped out by about $12k of value loss. Plan a longer hold.
- Fairbanks North Star County population projected at +6% by 2050 — modest demand growth; plan on rents tracking national, not racing it.
- At projected returns (-3.0% appreciation + 5.1% rent growth), your $109k cash investment doubles in ~8 years — after that, you're playing with house money.
Negotiation context
- It's been on market 20 days — a 2% lower offer ($384k) is reasonable based on typical stale-listing flexibility.
- 6 sale attempts since 5y ago; this cycle's ask is 8% above the opening price — seller raised mid-cycle; expect resistance to lowballs.
Questions for the listing agent
- Can we see the unit-by-unit rent roll, current vacancy, and any below-market leases? What's the average tenancy length?
- What capital expenditures (roof, boiler, parking lot, exteriors) have been made in the last 5 years, and what's planned in the next 2?
- Built in 1975 — when were the roof, HVAC, electrical panel, plumbing, and water heater last replaced?
- Is there a deadline driving the sale (1031 exchange, divorce, estate, relocation)? That informs how much negotiation room exists.
- Schools are D-rated, which usually means shorter tenancies and higher turnover. Who's the typical renter profile here, and what's been the actual vacancy rate?
- Crime grade is F in this area — have there been break-ins, vandalism, or insurance claims at this property in the last 3 years? What carrier currently insures it and at what premium?
- What's the average days-on-market for RENTAL listings here right now (not sales)? A rising rental-DOM trend means longer vacancies and softer asking-rent achievability than the comps imply.
- What's the recent tenant-quality profile in this submarket — average credit score on applications, eviction rate, late-payment / NSF rate, and stable-employment percentage? A property-management company in the area should have these aggregated.
- How much new apartment / multifamily construction is in the pipeline within 1–3 miles? Heavy new supply (>2% of stock underway) typically softens rents 12–24 months out; light construction supports rent growth.
Investment metrics
- 1% rule
- 1.18% ✓
- Cap rate
- 9.60%
- Cash-on-cash
- 11.80%
- DSCR
- 1.52
- GRM
- 7.0
CMA / ARV
- ARV (median comp)
- $479,486
- List price
- $389,900
- Delta
- -18.68%
- Verdict
- UNDERPRICED
- Comps
- 3 within 1.0 mi
Show comp detail 1 sale within ~0.75 mi
| Address | Dist | Beds/Ba | Sqft | Sold | Price | $/sf | Match |
|---|---|---|---|---|---|---|---|
| 872 Ridge Loop Rd | 0.00mi | 6/2.0 | 2,600 (+2%) | 22mo | $309,900 | $119 | 78 |
Match score weights: distance 35% · size 25% · config 20% · recency 20%. Top-matched comps best support the ARV.
Projected returns pro-forma
-3.0% appreciation · 5.08% rent growth · sell at horizon
- IRR
- 3.5%
- Equity multiple
- 1.14×
- Total profit
- $15,038
- Equity at exit
- $58,135
- IRR
- 14.8%
- Equity multiple
- 2.31×
- Total profit
- $143,334
- Equity at exit
- $33,711
Cash invested: $109,172 (down + closing). Projections, not guarantees.
Landlord ↔ Tenant lean methodology
- Overall (STATE)
- 80 Strongly Landlord-Friendly
- State Alaska
- 80 Strongly Landlord-Friendly · R+8
- County
- — inherits STATE
- City
- — inherits STATE
ZIP-level market 99705
- Home prices YoY
- -21.2%
- Rents YoY
- 5.1%
- Active inventory
- 248
- Price-to-rent
- 14.1×
Monthly cashflow live
- Estimated rent
- $4,617 medium interval (Pro) →
- Mortgage (P&I)
- −$2,045
- Tax from tax record
- −$367 /mo · $4,404/yr
- Insurance
- −$162
- HOA
- −$0
- Vacancy / Maint / Mgmt
- −$970
- Net cashflow
- $1,073
Break-even live
2-unit breakdown (identical units grouped — click to expand)
| Units | Beds | Baths | Est. rent |
|---|---|---|---|
| 2× units | 3 | 1 | $4,618 |
| #1 | 3 | 1 | $2,309 |
| #2 | 3 | 1 | $2,309 |
| Total (2 units) | $4,617 | ||
UW: 25.0% down · 7.5% · 30yr · 1.5% tax · 5.0% vac · 8.0% maint · 8.0% mgmt
Financing live
Cash to close
- Down payment
- $97,475
- Closing costs
- $11,697
- Reserves months
- —
- Total cash needed
- —
Loan-product check · same deal, 3 products live
Conventional
25% down · 7.5% · 30yr
- Down + closing
- —
- Monthly P&I
- —
- Monthly cashflow
- —
- DSCR
- —
- Eligible?
- —
Personal DTI + credit; lowest rate.
DSCR
20% down · 8.5% · 30yr
- Down + closing
- —
- Monthly P&I
- —
- Monthly cashflow
- —
- DSCR
- —
- Eligible?
- —
No personal income docs; deal must DSCR.
Hard money
10% down · 12.0% · 12mo
- Down + closing
- —
- Monthly P&I
- —
- Monthly cashflow
- —
- DSCR
- —
- Eligible?
- —
Short-term bridge; refi at stabilization.
Listing history 20 events
-
2026-06-05days on market $389,900 Active 20 DOM
-
2026-06-03days on market $389,900 Active 19 DOM
-
2026-06-02days on market $389,900 Active 18 DOM
-
2026-06-01days on market $389,900 Active 17 DOM
-
2026-05-31days on market $389,900 Active 16 DOM
-
2026-05-30days on market $389,900 Active 15 DOM
-
2026-05-15$389,900 Active 1042-char remark
-
2026-03-18status Active
-
2026-03-12price $349,900
-
2026-03-12price $349,900
-
2026-01-30$359,900 Active
-
2026-01-30$359,900 Active
-
2024-08-09soldstatus
-
2024-06-19$309,900
-
2022-01-31soldstatus
-
2022-01-27soldstatus
-
2021-10-06status Pending
-
2021-08-13$300,000 Active
-
2021-08-13$300,000
-
2009-12-16soldstatus
ⓘ Source: listings_history table (triggers on properties + properties_extension) + one-shot
backfill from property_details.listing_events for pre-trigger history.
Tax reassessment forecast AK · Partial reset (capped growth)
- Current annual tax
- $4,404 · $367/mo
- Projected year-2 tax
- $4,522 · $377/mo
- Expected delta
- +$118/yr (+$10/mo · 2.7%)
ⓘ Screening estimate from a state-policy table — verify with the county assessor before closing.
Climate risk First Street
- Flood 1/10 Low FEMA zone X (unshaded) · 0% chance over 30 yrs
- Air quality 1/10 Low
Nearby sold comps map
Loading sold comps map…
Walkable amenities ~0.75 mi
Loading nearby amenities…
Taxation est. · year 1
- Rental income
- $55,404
- − Mortgage interest
- −$21,840
- − Property taxes
- −$4,404
- − Insurance
- −$1,950
- − Repairs & maintenance
- −$4,432
- − Management
- −$4,432
- − Depreciation
- −$11,343
- Taxable income
- $7,003
- Est. tax owed @ 24.0%
- −$1,681
- After-tax cash flow
- $11,199/yr
For passive investors: Depreciation is non-cash, so a rental often shows a tax loss while cash-flowing — sheltering income. Rental losses are passive: they offset passive income freely, and up to $25,000/yr can offset ordinary (W-2) income if you actively participate and your MAGI is under $100k (phasing out to $0 by $150k); unused losses carry forward. On sale, claimed depreciation is recaptured at up to 25%, and gains may owe capital-gains tax (a 1031 exchange can defer both). Figures are a year-1 estimate at your 24.0% rate — not tax advice; consult a CPA.
Schools (NCES district)
- District
- Fairbanks North Star Borough School District
- NCES district ID
- 0200600
- Math proficiency
- 33% ▼ -6.00%
- Reading proficiency
- 45% ▲ 3.00%
- Median HH income
- $69,697
- Composite
- 35.5/100
- National rank
- #4915
- State rank
- #10 of 21 in AK
Livability — Badger
- Score
- 63/100
- State rank
- #49
- US rank
- #15681
Category grades
Schools grade is shown separately in the Schools card above.
Census & demographics
- Census place
- Badger, AK
- County
- Fairbanks North Star Borough · 69,381 people
- City population
- 22,281
- Metro
- Fairbanks, AK
- Population (ZIP)
- 21,769
- Household income
- $96,964
- Rent vs Own
- Severe rent burden
- 237.0
Population outlook (Fairbanks North Star County) Hauer SSP2
- Today (2025)
- 101,607 people
- By 2030
- 102,796 · +1.2%
- By 2040
- 104,748 · +3.1%
- By 2050
- 107,598 · +5.9%
- By 2075
- 118,829 · +16.9%
- By 2100
- 127,151 · +25.1%
Race, ethnicity, and origin ACS 2023
- Neighborhood character
- Predominantly White (75%)
- Race & ethnicity
- White 75% Two or more races 12% Hispanic / Latino 7% Native American 4% Black 1% Asian 1%
- Hispanic origin (detail)
- Mexican 5% Puerto Rican 1%
- Common ancestry
- Italian 4% Portuguese 3% Scottish 3%
- Foreign-born
- 4% · Canada, South Korea
- Languages at home
- 93% English-only · French/Haitian/Cajun 1% Spanish 1% Tagalog/Filipino 1%
Political lean MEDSL · Fairbanks North Star
- 2016 margin
- R (+15.2) · D 37.7% · R 52.9% · Other 9.4%
- All cycles
- 2016: R+15.2
Not yet ingested
- Civics
- —
Market trends
- HPI YoY
- ▼ -42.32%
- Current HPI
- 157.102
- Rent YoY
- ▲ 5.08%
- Metro
- Fairbanks, AK
- State GDP YoY
- —
- F500 in state
- 0
Price history
+16.6% since first listed13 events — show timeline
- 2026-03-18 Relisted — GFBR
- 2026-03-12 Price Changed $349,900 GFBR
- 2026-03-12 Price Changed $349,900 AKMLS
- 2026-01-30 Listed $359,900 AKMLS
- 2026-01-30 Listed $359,900 GFBR
- 2024-08-09 Sold (MLS) — AKMLS
- 2024-06-19 Listed $309,900 AKMLS
- 2022-01-31 Sold (MLS) — GFBR
- 2022-01-27 Sold (Public Records) — Public Records
- 2021-10-06 Pending — AKMLS
- 2021-08-13 Listed $300,000 GFBR
- 2021-08-13 Listed $300,000 AKMLS
- 2009-12-16 Sold (Public Records) — Public Records
Property tax history
+2.7%/yrLatest (2025): $4,404 · +2.7% YoY. Source: county tax records.
Cash-flow waterfall
monthlySold comps — $/sqft
last 12 mo · ≤1 miLoading sold comps…