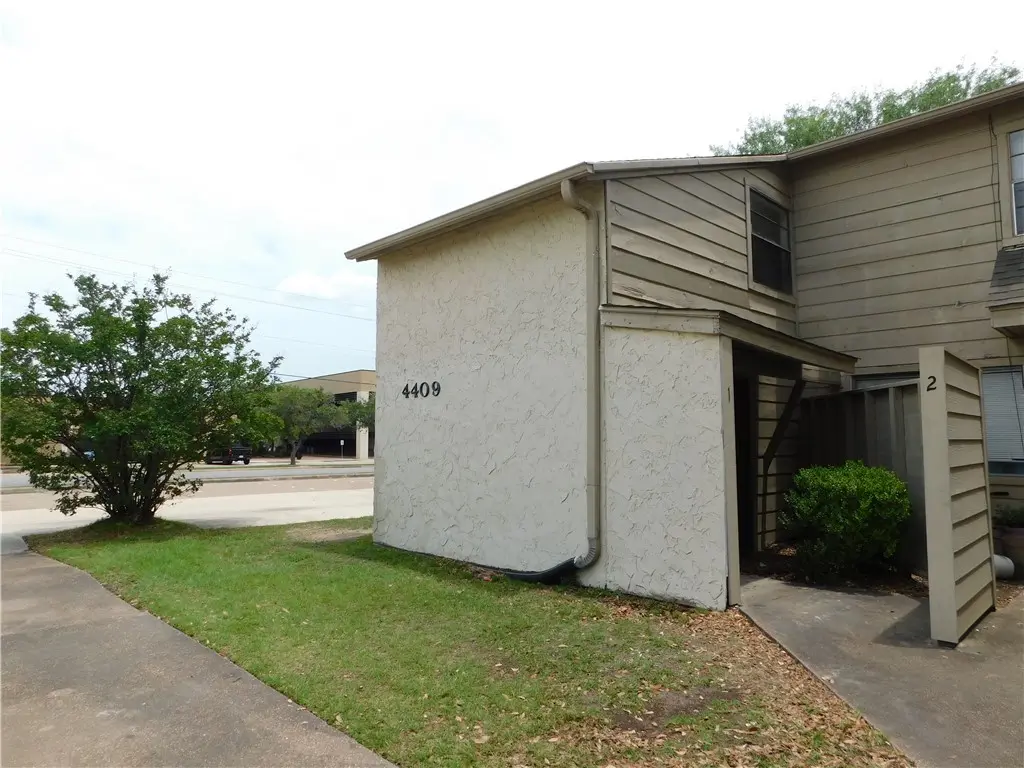
4409 Carter Creek Pkwy #1
Bryan, TX 77802
$110,000D-
1 bd · 1.0 ba ·
720 sqft ·
Built 1978
· Townhouse
· Active
· 23 DOM
Cashflow @ list (25.0% down · 7.5%)
Estimated rent
$1,011/mo
Mortgage (P&I)
−$577
Tax + insurance
−$227
HOA
−$13
Vac / Maint / Mgmt
−$212
Net cashflow
$-18/mo
Annual
$-215/yr
Cap rate
6.10%
Cash-on-cash
-0.70%
DSCR
0.97
1% rule
0.92%
Cash to close
$30,800
Investor read
- This is a 1-bed/1.0-bath townhouse listed at $110k.
- At list price, monthly cash flow is $-18 ($-215/yr) — negative.
- To cash-flow at today's rent, offer at most $107k (2.9% below list).
- To meet the 1% rule (rent ≥ 1% of price), the offer needs to be $101k (8.1% below list).
- It's been on market 23 days — a 2% lower offer ($108k) is reasonable based on typical stale-listing flexibility.
- Recommended offer: $101k (8.1% below list) — sets the bar for 1% rule.
- Local home prices are declining (-3.0%/yr); year-one equity from $761 of loan paydown is wiped out by about $3k of value loss. Plan a longer hold.
- Location reads 76/100 on livability (#99 in TX, #3,341 nationally) — a middle-class / working-renter tenant base. Strengths: cost of living A+, housing A+, health & safety A+; Watch: schools C-, crime C-, amenities C-.
- Bryan ISD (urban): math 30% / reading 32% proficiency, ranked #608 of 826 in TX (top 74%) — families likely to look elsewhere, expect single-tenant / working-renter base with shorter leases; 68% free/reduced lunch — lower-income household profile, screen leases tightly.
- Market conditions: Rents rising (+1.8%/yr); 278 active listings in the ZIP; 1 comparable units currently listed for rent nearby; 2,211 units permitted in Brazos County in 2024 (768 in 5+ unit buildings).
- Brazos County population projected at +55% by 2050 — long-run rental-demand tailwind backs the buy-and-hold thesis.
- Cap rate 6.1% vs local median 4.0% in Bryan — top-decile yield for the area; either an underpriced asset or a hidden risk that comps aren't pricing in. Stress-test before assuming the spread holds.
- This rent is only 17% of the median local income ($71k/yr) — well below the 30% rent-burden line; pricing power to push rent on renewal without tenant pushback.
Questions for listing agent
- What do current leases actually rent for vs. the listed asking? Can we see a recent rent roll and the last 12 months of T-12 income?
- Built in 1978 — when were the roof, HVAC, electrical panel, plumbing, and water heater last replaced?
- What does the HOA fee cover, when was the last increase, and are there any pending special assessments or reserve-fund shortfalls?
- Is there a deadline driving the sale (1031 exchange, divorce, estate, relocation)? That informs how much negotiation room exists.
- The area grade is low — what's the realistic commute time and amenity access for the typical tenant pool here? Any planned neighborhood developments (good or bad) we should know about?
- What's the average days-on-market for RENTAL listings here right now (not sales)? A rising rental-DOM trend means longer vacancies and softer asking-rent achievability than the comps imply.
- What's the recent tenant-quality profile in this submarket — average credit score on applications, eviction rate, late-payment / NSF rate, and stable-employment percentage? A property-management company in the area should have these aggregated.
- How much new for-sale + rental construction is in the pipeline within 1–3 miles? Heavy new supply typically softens prices + rents 12–24 months out; constrained supply supports both.
CashFlowRE · CFR-VPFWS5EGE4FSWC
· Data 2 days ago
cashflowre.app · 2026-05-29