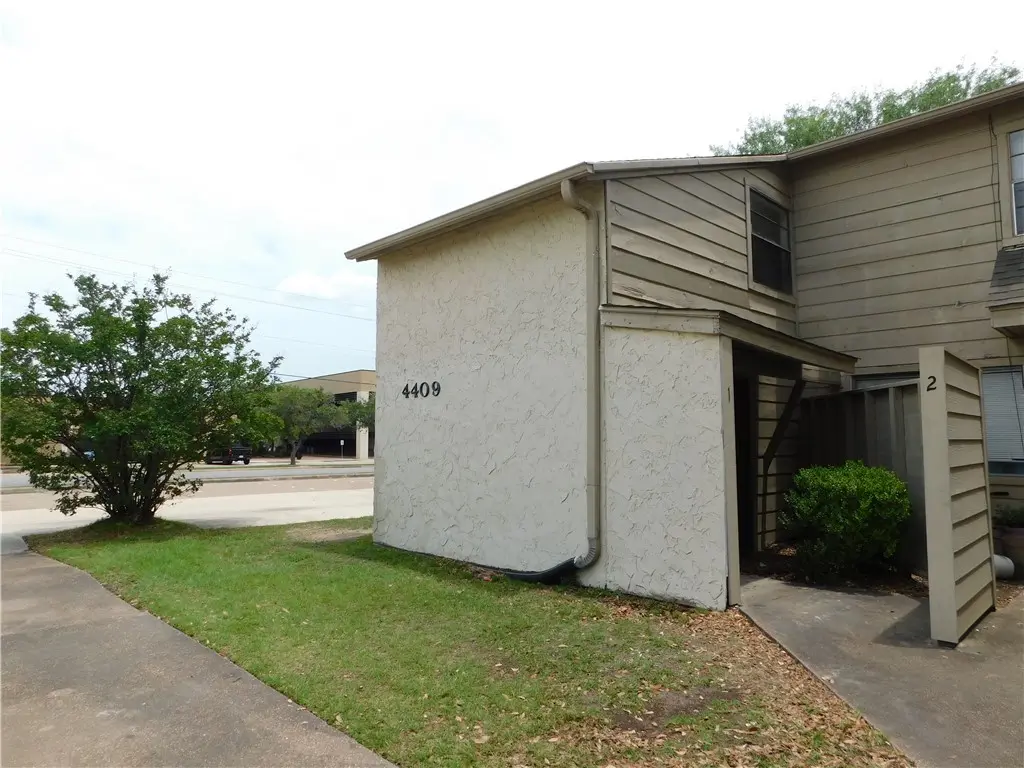
4409 Carter Creek Pkwy #1 · Bryan, TX
Flood risk No data
- FEMA flood zone
- —
- Chance of flooding over 30 yrs
- —
- Est. flood insurance / yr
- —
Fire risk No data
- Est. fire insurance / yr
- —
Heat risk No data
- Hot days now (above threshold)
- —
- Hot days in 30 yrs
- —
Wind risk No data
- Chance of severe wind over 30 yrs
- —
Air-quality risk No data
- Unhealthy air days now
- —
- Unhealthy air days in 30 yrs
- —
Risk factors via First Street. Map © Google.
Why this score? — see what drove the D- grade
The composite is a weighted blend of 9 inputs, each scored 0–100. Each bar is that input's sub-score; the figure is the points it added to the 100-point composite (weight × sub-score).
- Cash flow +12.4/30.0
- ARV discount +5.4/15.0
- 1% rule +4.2/10.0
- Livability +3.8/5.0
- DSCR +3.7/10.0
- Rent growth +3.0/5.0
- Schools +2.6/10.0
- Condition / age +2.5/5.0
- Appreciation +0.0/10.0
$110,000
🖨 Deal sheet 📄 Offer letter ✓ Due diligence
Listing remarks
Tucked within the April Court Townhomes in Bryan, Texas, this upgraded 1-bedroom, 1-bathroom townhouse offers a perfect blend of comfort and tranquility. The layout features an updated kitchen with granite countertops and new appliances. The living and dining areas provide a open and relaxing environment, featuring fresh paint and new flooring throughout. Large sliding doors in the living room provide ample natural light and an open feel. Upstairs, the loft-style bedroom includes a walk-in closet and an en-suite bathroom. April Court Townhomes is conveniently located near shopping, restaurants, and Texas A & M University. This residence offers an excellent opportunity to enjoy a peacefu
Key facts
- Walk-in closet
- New appliances
- Updated kitchen
Tags
Property features AI
Finance
- Other: Community pool listed under association and property features
- HOA & community: Homeowners association with annual fee of $150 (about $12.50/month); HOA includes water, insurance, grounds and structure maintenance, and sewer; Community amenities include pool and management
Exterior
- Parking: No designated parking
- Security: Smoke detector(s)
- Utilities: Public water; Public sewer; Electricity available; Underground utilities; Water available; Sewer available
- Home design: Residential townhouse; Two levels; Entry level not specified; Facing direction not specified; Subdivision: April Court Townhomes
- Construction: HardiPlank type and stucco exterior; Shingle (composition) roof; Slab foundation; Built (year not specified)
- Exterior features: Community pool; No fencing; Lot size approximately 0.0626 acres
Interior
- Kitchen: Dishwasher; Electric range; Disposal; Microwave; Refrigerator; Granite counters
- Bedrooms: Total of 5 rooms (bedroom count not specified separately)
- Flooring: Vinyl
- Bathrooms: 1 full bathroom
- Heating & cooling: Central heating (electric); Central air; Ceiling fan(s)
- Interior features: Granite counters; Ceiling fan(s); Smoke detector(s)
- Laundry & utility: Washer hookup; Electric water heater
Neighborhood map
What this means for you Summary
Snapshot
- This is a 1-bed/1.0-bath townhouse listed at $110k.
Deal economics
- At list price, monthly cash flow is $-18 ($-215/yr) — negative.
- To cash-flow at today's rent, offer at most $107k (2.9% below list).
- To meet the 1% rule (rent ≥ 1% of price), the offer needs to be $101k (8.1% below list).
- Recommended offer: $101k (8.1% below list) — sets the bar for 1% rule.
- Cap rate 6.1% vs local median 4.0% in Bryan — top-decile yield for the area; either an underpriced asset or a hidden risk that comps aren't pricing in. Stress-test before assuming the spread holds.
Location & tenants
- Location reads 76/100 on livability (#99 in TX, #3,341 nationally) — a middle-class / working-renter tenant base. Strengths: cost of living A+, housing A+, health & safety A+; Watch: schools C-, crime C-, amenities C-.
- Bryan ISD (urban): math 30% / reading 32% proficiency, ranked #608 of 826 in TX (top 74%) — families likely to look elsewhere, expect single-tenant / working-renter base with shorter leases; 68% free/reduced lunch — lower-income household profile, screen leases tightly.
- Market conditions: Rents rising (+1.8%/yr); 278 active listings in the ZIP; 1 comparable units currently listed for rent nearby; 2,211 units permitted in Brazos County in 2024 (768 in 5+ unit buildings).
- This rent is only 17% of the median local income ($71k/yr) — well below the 30% rent-burden line; pricing power to push rent on renewal without tenant pushback.
Forward outlook
- Local home prices are declining (-3.0%/yr); year-one equity from $761 of loan paydown is wiped out by about $3k of value loss. Plan a longer hold.
- Brazos County population projected at +55% by 2050 — long-run rental-demand tailwind backs the buy-and-hold thesis.
Negotiation context
- It's been on market 23 days — a 2% lower offer ($108k) is reasonable based on typical stale-listing flexibility.
Questions for the listing agent
- What do current leases actually rent for vs. the listed asking? Can we see a recent rent roll and the last 12 months of T-12 income?
- Built in 1978 — when were the roof, HVAC, electrical panel, plumbing, and water heater last replaced?
- What does the HOA fee cover, when was the last increase, and are there any pending special assessments or reserve-fund shortfalls?
- Is there a deadline driving the sale (1031 exchange, divorce, estate, relocation)? That informs how much negotiation room exists.
- The area grade is low — what's the realistic commute time and amenity access for the typical tenant pool here? Any planned neighborhood developments (good or bad) we should know about?
- What's the average days-on-market for RENTAL listings here right now (not sales)? A rising rental-DOM trend means longer vacancies and softer asking-rent achievability than the comps imply.
- What's the recent tenant-quality profile in this submarket — average credit score on applications, eviction rate, late-payment / NSF rate, and stable-employment percentage? A property-management company in the area should have these aggregated.
- How much new for-sale + rental construction is in the pipeline within 1–3 miles? Heavy new supply typically softens prices + rents 12–24 months out; constrained supply supports both.
Investment metrics
- 1% rule
- 0.92% ✗
- Cap rate
- 6.10%
- Cash-on-cash
- -0.70%
- DSCR
- 0.97
- GRM
- 9.1
CMA / ARV
- ARV (on-the-fly)
- $105,120
- Comps found
- 1
Show comp detail 1 sale within ~0.75 mi
| Address | Dist | Beds/Ba | Sqft | Sold | Price | $/sf | Match |
|---|---|---|---|---|---|---|---|
| 4401 Carter Creek Pkwy #13 | 0.06mi | 1/1.0 | 720 (0%) | 0mo | $104,900 | $146 | 97 |
Match score weights: distance 35% · size 25% · config 20% · recency 20%. Top-matched comps best support the ARV.
Projected returns pro-forma
-3.0% appreciation · 1.82% rent growth · sell at horizon
- IRR
- -18.8%
- Equity multiple
- 0.35×
- Total profit
- $-20,101
- Equity at exit
- $16,401
- IRR
- -14.0%
- Equity multiple
- 0.24×
- Total profit
- $-23,522
- Equity at exit
- $9,511
Cash invested: $30,800 (down + closing). Projections, not guarantees.
Landlord ↔ Tenant lean methodology
- Overall (STATE)
- 87 Strongly Landlord-Friendly
- State Texas
- 87 Strongly Landlord-Friendly · R+5
- County
- — inherits STATE
- City
- — inherits STATE
ZIP-level market 77802
- Rents YoY
- 1.8%
- Active inventory
- 278
- Price-to-rent
- 9.1×
Monthly cashflow live
- Estimated rent
- $1,011 medium interval (Pro) →
- Mortgage (P&I)
- −$577
- Tax from tax record
- −$181 /mo · $2,174/yr
- Insurance
- −$46
- HOA
- −$13
- Vacancy / Maint / Mgmt
- −$212
- Net cashflow
- $-18
Break-even live
UW: 25.0% down · 7.5% · 30yr · 1.5% tax · 5.0% vac · 8.0% maint · 8.0% mgmt
Financing live
Cash to close
- Down payment
- $27,500
- Closing costs
- $3,300
- Reserves months
- —
- Total cash needed
- —
Loan-product check · same deal, 3 products live
Conventional
25% down · 7.5% · 30yr
- Down + closing
- —
- Monthly P&I
- —
- Monthly cashflow
- —
- DSCR
- —
- Eligible?
- —
Personal DTI + credit; lowest rate.
DSCR
20% down · 8.5% · 30yr
- Down + closing
- —
- Monthly P&I
- —
- Monthly cashflow
- —
- DSCR
- —
- Eligible?
- —
No personal income docs; deal must DSCR.
Hard money
10% down · 12.0% · 12mo
- Down + closing
- —
- Monthly P&I
- —
- Monthly cashflow
- —
- DSCR
- —
- Eligible?
- —
Short-term bridge; refi at stabilization.
Rent comps 1 comps
| Address | Beds | Baths | Sqft | Rent | $/sqft | DOM | Units | Dist |
|---|---|---|---|---|---|---|---|---|
| 402 Summer Ct Unit 2B College Station, TX | 2.0 | 2.0 | 750 | $900 | $1.20 | 43d | 1 | 0.45mi |
HOA detail
- Monthly dues
- $13 · $156/yr
Listing history 18 events
-
2026-06-18days on market $110,000 Active 23 DOM
-
2026-06-17days on market $110,000 Active 22 DOM
-
2026-06-16days on market $110,000 Active 21 DOM
-
2026-06-15days on market $110,000 Active 20 DOM
-
2026-06-14days on market $110,000 Active 18 DOM
-
2026-06-13days on market $110,000 Active 17 DOM
-
2026-06-10days on market $110,000 Active 15 DOM
-
2026-06-09days on market $110,000 Active 14 DOM
-
2026-06-08days on market $110,000 Active 13 DOM
-
2026-06-07days on market $110,000 Active 12 DOM
-
2026-06-03days on market $110,000 Active 8 DOM
-
2026-06-02days on market $110,000 Active 7 DOM
-
2026-06-01days on market $110,000 Active 6 DOM
-
2026-05-31days on market $110,000 Active 5 DOM
-
2026-05-30days on market $110,000 Active 4 DOM
-
2026-05-26$110,000 Active
-
2012-09-05soldstatus
-
1980-09-10soldstatus
ⓘ Source: listings_history table (triggers on properties + properties_extension) + one-shot
backfill from property_details.listing_events for pre-trigger history.
Tax reassessment forecast TX · Resets to sale price
- Current annual tax
- $2,174 · $181/mo
- Projected year-2 tax
- $2,174 · $181/mo
- Expected delta
- $0/yr ($0/mo · 0.0%)
ⓘ Screening estimate from a state-policy table — verify with the county assessor before closing.
Nearby sold comps map
Loading sold comps map…
Walkable amenities ~0.75 mi
Loading nearby amenities…
Taxation est. · year 1
- Rental income
- $12,136
- − Mortgage interest
- −$6,162
- − Property taxes
- −$2,174
- − Insurance
- −$550
- − Repairs & maintenance
- −$971
- − Management
- −$971
- − HOA
- −$156
- − Depreciation
- −$3,200
- Taxable loss
- −$2,047
- Est. tax savings @ 24.0%
- +$491
- After-tax cash flow
- $277/yr
For passive investors: Depreciation is non-cash, so a rental often shows a tax loss while cash-flowing — sheltering income. Rental losses are passive: they offset passive income freely, and up to $25,000/yr can offset ordinary (W-2) income if you actively participate and your MAGI is under $100k (phasing out to $0 by $150k); unused losses carry forward. On sale, claimed depreciation is recaptured at up to 25%, and gains may owe capital-gains tax (a 1031 exchange can defer both). Figures are a year-1 estimate at your 24.0% rate — not tax advice; consult a CPA.
Schools (NCES district)
- District
- Bryan ISD
- NCES district ID
- 4811790
- Math proficiency
- 30% ▼ -8.00%
- Reading proficiency
- 32% ▼ -3.00%
- Median HH income
- $41,895
- Composite
- 26.26/100
- National rank
- #7253
- State rank
- #608 of 826 in TX
Livability — Bryan
- Score
- 76/100
- State rank
- #99
- US rank
- #3341
Category grades
Schools grade is shown separately in the Schools card above.
Census & demographics
- Census place
- Bryan, TX
- County
- Brazos County · 233,400 people
- City population
- 101,772
- Metro
- College Station-Bryan, TX
- Population (ZIP)
- 25,762
- Household income
- $70,666
- Rent vs Own
- Severe rent burden
- 1559.0
Population outlook (Brazos County) Hauer SSP2
- Today (2025)
- 267,942 people
- By 2030
- 296,630 · +10.7%
- By 2040
- 354,560 · +32.3%
- By 2050
- 414,616 · +54.7%
- By 2075
- 562,158 · +109.8%
- By 2100
- 678,828 · +153.3%
Race, ethnicity, and origin ACS 2023
- Neighborhood character
- Diverse neighborhood (Simpson 0.58)
- Race & ethnicity
- White 59% Hispanic / Latino 26% Two or more races 12% Black 11% Asian 2%
- Hispanic origin (detail)
- Mexican 23%
- Common ancestry
- Lithuanian 3% Slovak 2% Italian 2%
- Foreign-born
- 7% · Canada, South Korea
- Languages at home
- 82% English-only · Spanish 15% Korean 1% Russian/Polish/Slavic 1%
Political lean MEDSL · Brazos
- 2024 margin
- Strong R (+24.9) · D 36.9% · R 61.7% · Other 1.4%
- 2008→2024 swing
- +4.1pp toward D · 2008: -28.9pp · 2024: -24.9pp
- All cycles
- 2024: R+24.9 2020: R+14.3 2016: R+23.7 2012: R+35.3 2008: R+28.9
Not yet ingested
- Civics
- —
Market trends
- HPI YoY
- ▼ -148.67%
- Current HPI
- 202.0858
- Rent YoY
- ▲ 1.82%
- Metro
- College Station-Bryan, TX
- State GDP YoY
- ▲ 3.95%
- F500 in state
- 110
Industry mix (Fortune 500 HQ in TX)
| Industry | F500 HQs | Revenue |
|---|---|---|
| Energy | 16 | $1,198B |
|
||
| Technology | 5 | $198B |
|
||
| Engineering / Construction | 4 | $72B |
|
||
| Energy Services | 3 | $60B |
|
||
| Utilities | 3 | $41B |
|
||
| Healthcare | 2 | $330B |
|
||
Price history
3 events — show timeline
- 2026-05-26 Listed $110,000 BCSRMLS
- 2012-09-05 Sold (Public Records) — Public Records
- 1980-09-10 Sold (Public Records) — Public Records
Property tax history
+7.7%/yrLatest (2025): $2,174 · +20.0% YoY. Source: county tax records.
Cash-flow waterfall
monthlySold comps — $/sqft
last 12 mo · ≤1 miLoading sold comps…