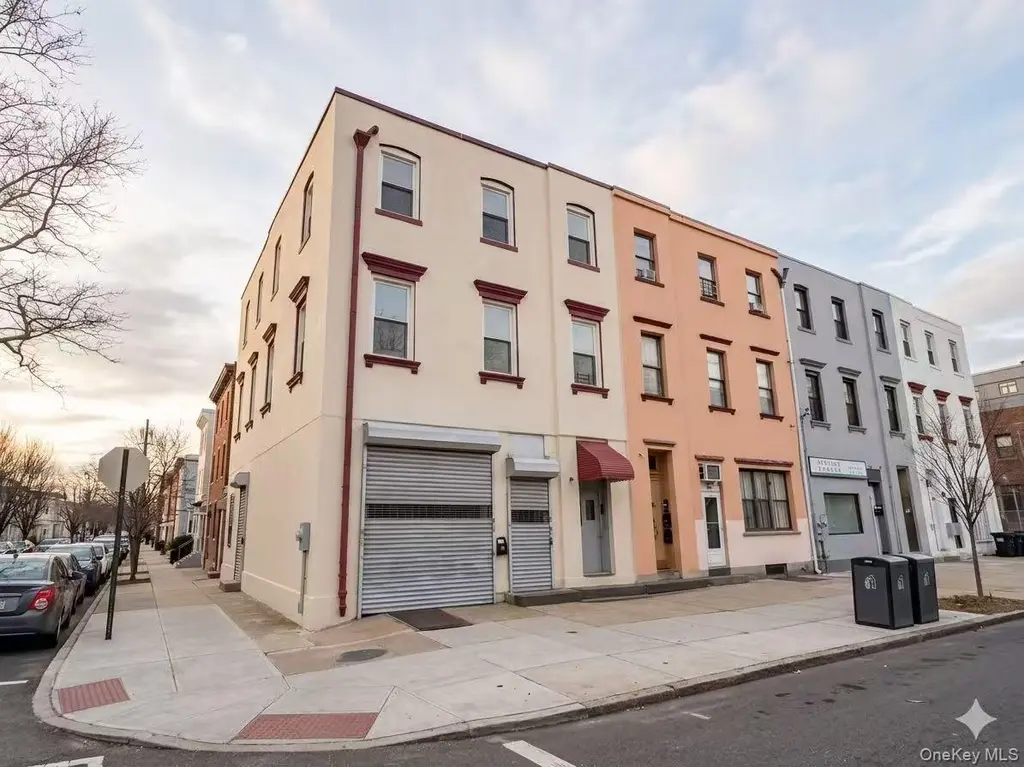
126-01 18th Ave
New York, NY 11356
$1,380,000D
None bd · None ba ·
4,000 sqft ·
Built 1935
· MultiFamily
· Pending
· 33 DOM
Cashflow @ list (25.0% down · 7.5%)
Estimated rent
$11,746/mo
Mortgage (P&I)
−$7,237
Tax + insurance
−$2,300
HOA
−$0
Vac / Maint / Mgmt
−$2,467
Net cashflow
$-258/mo
Annual
$-3,090/yr
Cap rate
6.07%
Cash-on-cash
-0.80%
DSCR
0.96
1% rule
0.85%
Cash to close
$386,400
Investor read
- This is a multifamily listed at $1.38M.
- At list price, monthly cash flow is $-258 ($-3k/yr) — negative.
- To cash-flow at today's rent, offer at most $1.34M (2.7% below list).
- To meet the 1% rule (rent ≥ 1% of price), the offer needs to be $1.17M (14.9% below list).
- It's been on market 33 days — a 3% lower offer ($1.34M) is reasonable based on typical stale-listing flexibility.
- Recommended offer: $1.17M (14.9% below list) — sets the bar for 1% rule.
- Local home prices are declining (-3.0%/yr); year-one equity from $10k of loan paydown is wiped out by about $41k of value loss. Plan a longer hold.
- Location reads 75/100 on livability (#268 in NY, #4,188 nationally) — a middle-class / working-renter tenant base. Strengths: amenities A+, commute A+, health & safety A; Watch: crime F, cost of living F.
- Zoned schools: Ps 129 Patricia Larkin (math 57% / reading 62%, grade B-, #745 of 2,108 statewide, top 39%, 1,162 students, 81% FRL); Is 227 Louis Armstrong (math 52% / reading 69%, grade B+, #153 of 729 statewide, top 21%, 1,528 students, 68% FRL); Midwood High School (math 94% / reading 96%, grade A+, #83 of 1,100 statewide, top 8%, 4,062 students, 73% FRL).
- Watch-outs: built in 1935 — expect roof / HVAC / electrical / plumbing capex.
- Market conditions: Rents rising fast (+12.1%/yr); 133 active listings in the ZIP; 2 comparable units currently listed for rent nearby; solid renter incomes; 5,302 units permitted in Queens County in 2024 (4,918 in 5+ unit buildings).
- Queens County population projected at +16% by 2050 — long-run rental-demand tailwind backs the buy-and-hold thesis.
- 4 sale attempts since 14y ago with the ask held roughly flat each time — persistent listings suggest the price (not the market) is what's stuck; bring a comps-based counter.
- Cap rate 6.1% vs local median 2.6% in New York — top-decile yield for the area; either an underpriced asset or a hidden risk that comps aren't pricing in. Stress-test before assuming the spread holds.
- At $11,746/mo this rent would consume 163% of the median local household income ($87k/yr) (locally 1545% of renters already pay >50% of income on rent) — very limited rent-growth headroom before tenants either downsize or default.
Questions for listing agent
- What do current leases actually rent for vs. the listed asking? Can we see a recent rent roll and the last 12 months of T-12 income?
- It's been on market 33 days. Have you received any prior offers? Is the seller open to a 15% concession, seller financing, or rate buy-down credit?
- Built in 1935 — when were the roof, HVAC, electrical panel, plumbing, and water heater last replaced?
- Is there a deadline driving the sale (1031 exchange, divorce, estate, relocation)? That informs how much negotiation room exists.
- Schools are B-rated — typically a magnet for longer-tenancy family renters. What's the average tenant stay here, and is there a school-zone premium baked into asking?
- Crime grade is F in this area — have there been break-ins, vandalism, or insurance claims at this property in the last 3 years? What carrier currently insures it and at what premium?
- The area grade is low — what's the realistic commute time and amenity access for the typical tenant pool here? Any planned neighborhood developments (good or bad) we should know about?
- What's the average days-on-market for RENTAL listings here right now (not sales)? A rising rental-DOM trend means longer vacancies and softer asking-rent achievability than the comps imply.
CashFlowRE · CFR-VQ7S4HE0NGYY0K
· Data 4 weeks ago
cashflowre.app · 2026-05-29