 Multi-family
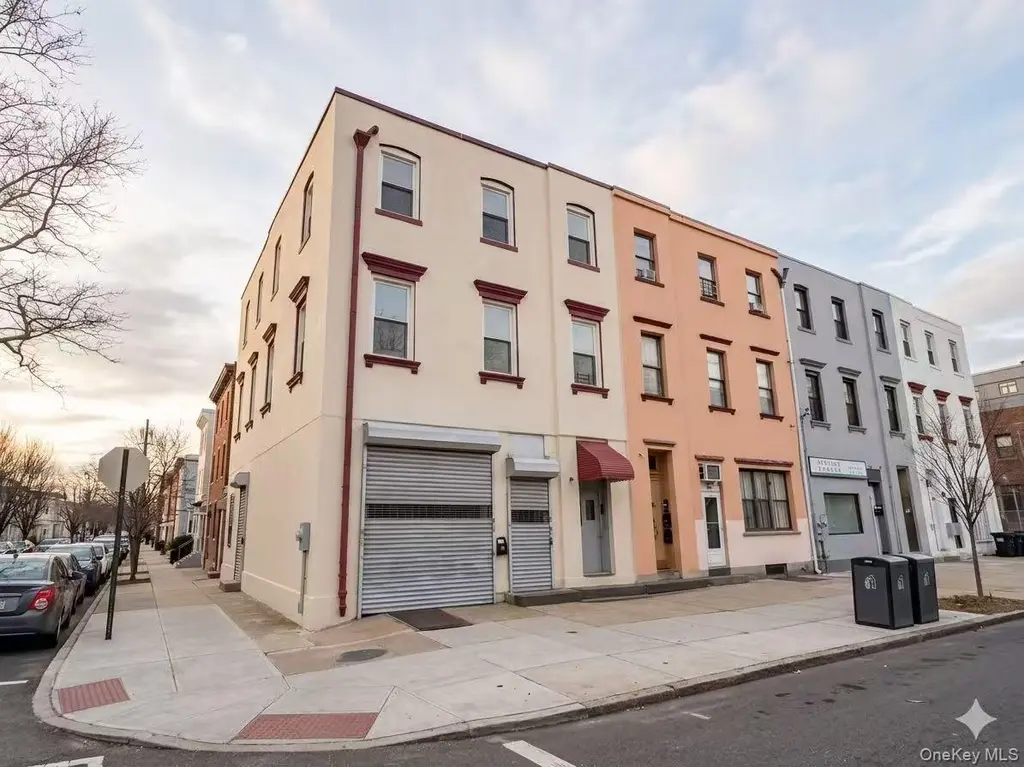
126-01 18th Ave · New York, NY
Flood risk No data
- FEMA flood zone
- —
- Chance of flooding over 30 yrs
- —
- Est. flood insurance / yr
- —
Fire risk No data
- Est. fire insurance / yr
- —
Heat risk No data
- Hot days now (above threshold)
- —
- Hot days in 30 yrs
- —
Wind risk No data
- Chance of severe wind over 30 yrs
- —
Air-quality risk No data
- Unhealthy air days now
- —
- Unhealthy air days in 30 yrs
- —
Risk factors via First Street. Map © Google.
Why this score? — see what drove the D grade
The composite is a weighted blend of 9 inputs, each scored 0–100. Each bar is that input's sub-score; the figure is the points it added to the 100-point composite (weight × sub-score).
- Cash flow +12.3/30.0
- ARV discount +7.5/15.0
- Rent growth +5.0/5.0
- Schools +5.0/10.0
- Livability +3.8/5.0
- DSCR +3.6/10.0
- 1% rule +3.5/10.0
- Condition / age +2.5/5.0
- Appreciation +0.0/10.0
$1,380,000
🖨 Deal sheet (PDF) 📄 Offer letter ✓ Due diligence
Multi-family units
County records classify this as Multi-Family (2-4 Unit). Listing-text estimate: 1 unit. estimate disagrees with records
Listing remarks
Rare investment opportunity in the heart of College Point. This semi-detached all-brick mixed-use building sits on a 25x100 lot with a 25x40 building footprint and rare M1-2 zoning. This property is a high-yield asset. The first floor is occupied by a stable commercial tenant with options to deliver vacant or keep for immediate cash flow. The second and third floors are fully renovated and delivered vacant, featuring a 2-bedroom 1.5-bathroom unit and a spacious 3-bedroom 1.5-bathroom unit respectively. The entire building has been updated internally and externally, including unit ACs, 3 separate gas meters, 3 electric meters, and 3 independent heating and hot water systems for easy manageme
Key facts
- M1-2 zoning
- Fully renovated
- Large backyard
Tags
Property features AI
Exterior
- Parking: Garage; Other parking features; 1 garage space; Has garage
- Utilities: Public sewer; Electricity connected; Natural gas connected
- Home design: Duplex; Measured building area ~4000 total
- Exterior features: Brick exterior; Not waterfront
Interior
- Heating & cooling: Ductless cooling; Natural gas heating; Other heating
- Interior features: Basement present (see remarks); Other interior features
Neighborhood map
What this means for you Summary
Snapshot
- This is a multifamily listed at $1.38M.
Deal economics
- At list price, monthly cash flow is $-258 ($-3k/yr) — negative.
- To cash-flow at today's rent, offer at most $1.34M (2.7% below list).
- To meet the 1% rule (rent ≥ 1% of price), the offer needs to be $1.17M (14.9% below list).
- Recommended offer: $1.17M (14.9% below list) — sets the bar for 1% rule.
- Cap rate 6.1% vs local median 2.6% in New York — top-decile yield for the area; either an underpriced asset or a hidden risk that comps aren't pricing in. Stress-test before assuming the spread holds.
Location & tenants
- Location reads 75/100 on livability (#268 in NY, #4,188 nationally) — a middle-class / working-renter tenant base. Strengths: amenities A+, commute A+, health & safety A; Watch: crime F, cost of living F.
- Zoned schools: Ps 129 Patricia Larkin (math 57% / reading 62%, grade B-, #745 of 2,108 statewide, top 39%, 1,162 students, 81% FRL); Is 227 Louis Armstrong (math 52% / reading 69%, grade B+, #153 of 729 statewide, top 21%, 1,528 students, 68% FRL); Midwood High School (math 94% / reading 96%, grade A+, #83 of 1,100 statewide, top 8%, 4,062 students, 73% FRL).
- Market conditions: Rents rising fast (+12.1%/yr); 133 active listings in the ZIP; 2 comparable units currently listed for rent nearby; solid renter incomes; 5,302 units permitted in Queens County in 2024 (4,918 in 5+ unit buildings).
- At $11,746/mo this rent would consume 163% of the median local household income ($87k/yr) (locally 1545% of renters already pay >50% of income on rent) — very limited rent-growth headroom before tenants either downsize or default.
Forward outlook
- Local home prices are declining (-3.0%/yr); year-one equity from $10k of loan paydown is wiped out by about $41k of value loss. Plan a longer hold.
- Queens County population projected at +16% by 2050 — long-run rental-demand tailwind backs the buy-and-hold thesis.
Negotiation context
- It's been on market 33 days — a 3% lower offer ($1.34M) is reasonable based on typical stale-listing flexibility.
- 4 sale attempts since 14y ago with the ask held roughly flat each time — persistent listings suggest the price (not the market) is what's stuck; bring a comps-based counter.
Risks & watch-outs
- Watch-outs: built in 1935 — expect roof / HVAC / electrical / plumbing capex.
Questions for the listing agent
- What do current leases actually rent for vs. the listed asking? Can we see a recent rent roll and the last 12 months of T-12 income?
- It's been on market 33 days. Have you received any prior offers? Is the seller open to a 15% concession, seller financing, or rate buy-down credit?
- Built in 1935 — when were the roof, HVAC, electrical panel, plumbing, and water heater last replaced?
- Is there a deadline driving the sale (1031 exchange, divorce, estate, relocation)? That informs how much negotiation room exists.
- Schools are B-rated — typically a magnet for longer-tenancy family renters. What's the average tenant stay here, and is there a school-zone premium baked into asking?
- Crime grade is F in this area — have there been break-ins, vandalism, or insurance claims at this property in the last 3 years? What carrier currently insures it and at what premium?
- The area grade is low — what's the realistic commute time and amenity access for the typical tenant pool here? Any planned neighborhood developments (good or bad) we should know about?
- What's the average days-on-market for RENTAL listings here right now (not sales)? A rising rental-DOM trend means longer vacancies and softer asking-rent achievability than the comps imply.
- What's the recent tenant-quality profile in this submarket — average credit score on applications, eviction rate, late-payment / NSF rate, and stable-employment percentage? A property-management company in the area should have these aggregated.
- How much new apartment / multifamily construction is in the pipeline within 1–3 miles? Heavy new supply (>2% of stock underway) typically softens rents 12–24 months out; light construction supports rent growth.
Investment metrics
- 1% rule
- 0.85% ✗
- Cap rate
- 6.07%
- Cash-on-cash
- -0.80%
- DSCR
- 0.96
- GRM
- 9.8
CMA / ARV
No comps found within radius.
Projected returns pro-forma
-3.0% appreciation · 8.0% rent growth · sell at horizon
- IRR
- -12.2%
- Equity multiple
- 0.54×
- Total profit
- $-177,769
- Equity at exit
- $205,762
- IRR
- 3.2%
- Equity multiple
- 1.28×
- Total profit
- $107,330
- Equity at exit
- $119,317
Cash invested: $386,400 (down + closing). Projections, not guarantees.
Landlord ↔ Tenant lean methodology
- Overall (CITY)
- 0 Strongly Tenant-Friendly
- State New York
- 15 Strongly Tenant-Friendly · D+10
- County
- — inherits STATE
- City New York
- 0 Strongly Tenant-Friendly · D+34
ZIP-level market 11356
- Home prices YoY
- -28.9%
- Rents YoY
- 12.1%
- Active inventory
- 133
- Price-to-rent
- 38.5×
Monthly cashflow live
- Estimated rent
- $11,746 high interval (Pro) →
- Mortgage (P&I)
- −$7,237
- Tax est. 1.5%
- −$1,725 /mo · $20,700/yr
- Insurance
- −$575
- HOA
- −$0
- Vacancy / Maint / Mgmt
- −$2,467
- Net cashflow
- $-258
Break-even live
Sensitivity live
| Price | -10% $696 | -5% $219 | +0% $-258 | +5% $-734 | +10% $-1,211 |
|---|---|---|---|---|---|
| Rent | -10% $-1,185 | -5% $-721 | +0% $-258 | +5% $206 | +10% $670 |
| Rate | -1.0pp $437 | -0.5pp $93 | base $-258 | +0.5pp $-615 | +1.0pp $-979 |
4-unit breakdown (identical units grouped — click to expand)
| Units | Beds | Baths | Est. rent |
|---|---|---|---|
| 1× unit | 2 | 1.5 | $2,984 |
| 1× unit | 3 | 1.5 | $3,212 |
| 2× units | 1 | 1.5 | $5,550 |
| #3 | 1 | 1.5 | $2,775 |
| #4 | 1 | 1.5 | $2,775 |
| Total (4 units) | $11,746 | ||
UW: 25.0% down · 7.5% · 30yr · 1.5% tax · 5.0% vac · 8.0% maint · 8.0% mgmt
Financing live
Cash to close
- Down payment
- $345,000
- Closing costs
- $41,400
- Reserves months
- —
- Total cash needed
- —
Loan-product check · same deal, 3 products live
Conventional
25% down · 7.5% · 30yr
- Down + closing
- —
- Monthly P&I
- —
- Monthly cashflow
- —
- DSCR
- —
- Eligible?
- —
Personal DTI + credit; lowest rate.
DSCR
20% down · 8.5% · 30yr
- Down + closing
- —
- Monthly P&I
- —
- Monthly cashflow
- —
- DSCR
- —
- Eligible?
- —
No personal income docs; deal must DSCR.
Hard money
10% down · 12.0% · 12mo
- Down + closing
- —
- Monthly P&I
- —
- Monthly cashflow
- —
- DSCR
- —
- Eligible?
- —
Short-term bridge; refi at stabilization.
Rent comps 2 comps
| Address | Beds | Baths | Sqft | Rent | $/sqft | DOM | Units | Dist |
|---|---|---|---|---|---|---|---|---|
| 14541 Willets Point Blvd Whitestone, NY | 3.0 | 1.5 | 3004 | $3,200 | $1.07 | 26d | 1 | 1.09mi |
| 14618 23rd Ave Whitestone, NY | 3.0 | 1.5 | 3556 | $3,400 | $0.96 | 8d | 1 | 1.16mi |
Listing history 7 events
-
2026-05-05status Pending
-
2026-04-02$1,380,000 Active
-
2014-10-05historical
-
2013-04-15status Under Contract
-
2013-01-30$669,000 New
-
2012-11-29$699,000
-
2012-11-28$669,000
ⓘ Source: listings_history table (triggers on properties + properties_extension) + one-shot
backfill from property_details.listing_events for pre-trigger history.
Nearby sold comps map
Loading sold comps map…
Walkable amenities ~0.75 mi
Loading nearby amenities…
Taxation est. · year 1
- Rental income
- $140,952
- − Mortgage interest
- −$77,301
- − Property taxes
- −$20,700
- − Insurance
- −$6,900
- − Repairs & maintenance
- −$11,276
- − Management
- −$11,276
- − Depreciation
- −$40,145
- Taxable loss
- −$26,647
- Est. tax savings @ 24.0%
- +$6,395
- After-tax cash flow
- $3,305/yr
For passive investors: Depreciation is non-cash, so a rental often shows a tax loss while cash-flowing — sheltering income. Rental losses are passive: they offset passive income freely, and up to $25,000/yr can offset ordinary (W-2) income if you actively participate and your MAGI is under $100k (phasing out to $0 by $150k); unused losses carry forward. On sale, claimed depreciation is recaptured at up to 25%, and gains may owe capital-gains tax (a 1031 exchange can defer both). Figures are a year-1 estimate at your 24.0% rate — not tax advice; consult a CPA.
Schools (NCES district)
No district data.
Livability — New York
- Score
- 75/100
- State rank
- #268
- US rank
- #4188
Category grades
Schools grade is shown separately in the Schools card above.
Census & demographics
- Census place
- New York, NY
- County
- Queens County · 1,914,869 people
- City population
- 7,731,280
- Metro
- New York-Newark-Jersey City, NY-NJ-PA
- Population (ZIP)
- 25,824
- Household income
- $86,730
- Rent vs Own
- Severe rent burden
- 1545.0
Population outlook (Queens County) Hauer SSP2
- Today (2025)
- 2,546,320 people
- By 2030
- 2,643,059 · +3.8%
- By 2040
- 2,815,563 · +10.6%
- By 2050
- 2,944,423 · +15.6%
- By 2075
- 3,123,338 · +22.7%
- By 2100
- 3,098,688 · +21.7%
Race, ethnicity, and origin ACS 2023
- Neighborhood character
- Diverse neighborhood (Simpson 0.66)
- Race & ethnicity
- Hispanic / Latino 42% Asian 35% White 21% Two or more races 8%
- Hispanic origin (detail)
- Mexican 3% Puerto Rican 5% Dominican 8%
- Common ancestry
- Romanian 1%
- Foreign-born
- 53% · Canada, China, South Korea
- Languages at home
- 26% English-only · Spanish 35% Chinese 23% Other Indo-European 8%
Political lean MEDSL · Queens
- 2024 margin
- Strong D (+24.6) · D 62.3% · R 37.7%
- 2008→2024 swing
- -26.2pp toward R · 2008: 50.8pp · 2024: 24.6pp
- All cycles
- 2024: D+24.6 2020: D+45.2 2016: D+53.4 2012: D+58.5 2008: D+50.8
Not yet ingested
- Civics
- —
Market trends
- HPI YoY
- ▼ -95.50%
- Current HPI
- 235.1217
- Rent YoY
- ▲ 12.13%
- Metro
- New York-Newark-Jersey City, NY-NJ-PA
- State GDP YoY
- ▲ 2.60%
- F500 in state
- 92
Industry mix (Fortune 500 HQ in NY)
| Industry | F500 HQs | Revenue |
|---|---|---|
| Financial Services | 10 | $950B |
|
||
| Consumer Goods | 9 | $162B |
|
||
| Insurance | 4 | $225B |
|
||
| Telecommunications | 2 | $144B |
|
||
| Pharmaceuticals | 2 | $112B |
|
||
| Media / Entertainment | 2 | $69B |
|
||
Price history
+106.3% since first listed7 events — show timeline
- 2026-05-05 Pending — OneKey® MLS as Distributed by MLS Grid
- 2026-04-02 Listed $1,380,000 OneKey® MLS as Distributed by MLS Grid
- 2014-10-05 Listing Removed — OneKey® MLS as Distributed by MLS Grid
- 2013-04-15 Pending — OneKey® MLS as Distributed by MLS Grid
- 2013-01-30 Listed $669,000 OneKey® MLS as Distributed by MLS Grid
- 2012-11-29 Listed $699,000 RLS at REBNY
- 2012-11-28 Listed $669,000 RLS at REBNY
Cash-flow waterfall
monthlySold comps — $/sqft
last 12 mo · ≤1 miLoading sold comps…