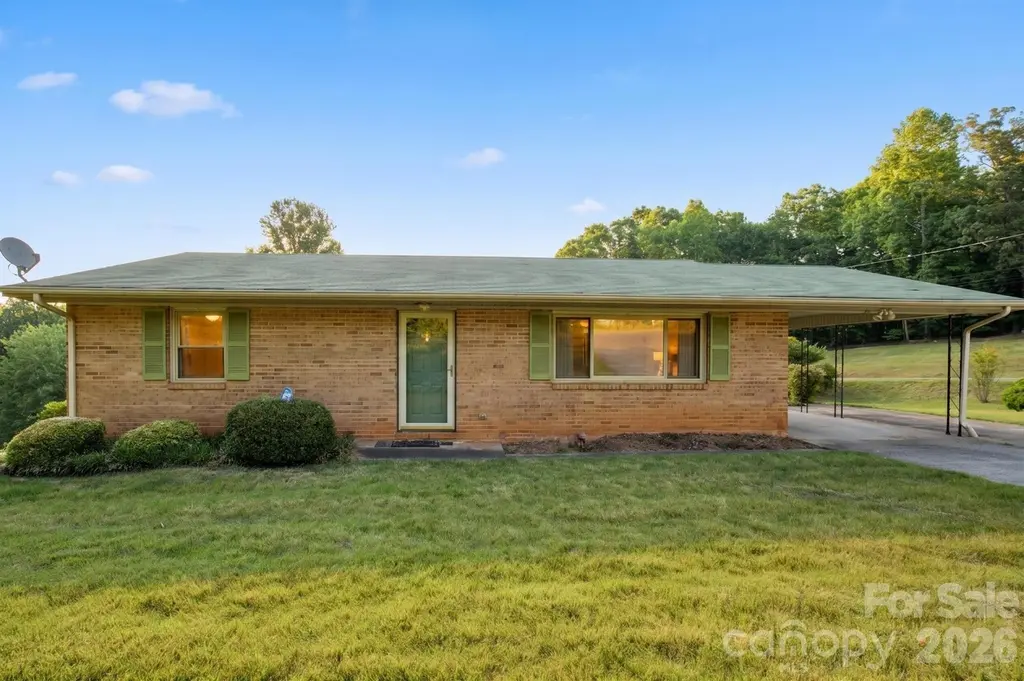
4024 Piney Rd
Gamewell, NC 28655
$199,900D-
3 bd · 0.5 ba ·
1,952 sqft ·
Built 1968
· SingleFamily
· Pending
· 17 DOM
Cashflow @ list (25.0% down · 7.5%)
Estimated rent
$1,549/mo
Mortgage (P&I)
−$1,048
Tax + insurance
−$164
HOA
−$0
Vac / Maint / Mgmt
−$325
Net cashflow
$12/mo
Annual
$142/yr
Cap rate
6.36%
Cash-on-cash
0.25%
DSCR
1.01
1% rule
0.78%
Cash to close
$55,972
Investor read
- This is a 3-bed/0.5-bath single-family listed at $200k.
- At list price, monthly cash flow is $12 ($142/yr) — positive.
- The deal already cash-flows at list — no discount required.
- To meet the 1% rule (rent ≥ 1% of price), the offer needs to be $155k (22.5% below list).
- It's been on market 17 days — a 2% lower offer ($197k) is reasonable based on typical stale-listing flexibility.
- Recommended offer: $155k (22.5% below list) — sets the bar for 1% rule.
- Local home prices are declining (-3.0%/yr); year-one equity from $1k of loan paydown is wiped out by about $6k of value loss. Plan a longer hold.
- Location reads 60/100 on livability (#518 in NC) — a middle-class / working-renter tenant base. Strengths: cost of living A+, housing A+, crime B+; Watch: employment D, amenities F, commute F.
- Burke County Schools (rural): math 43% / reading 47% proficiency, ranked #89 of 178 in NC (top 50%) — families likely to look elsewhere, expect single-tenant / working-renter base with shorter leases.
- Zoned schools: Mountain View Elementary (math 32% / reading 28%, grade F, #965 of 1,410 statewide, top 69%, 677 students, 85% FRL); Freedom High (math 61% / reading 51%, grade C, #264 of 535 statewide, top 49%, 1,414 students, 64% FRL) — zoned schools average 74% FRL vs 52% district-wide (22 pts higher); higher-poverty schools than district average — tighter screening recommended.
- Market conditions: 431 active listings in the ZIP; 422 units permitted in Burke County in 2024 (94 in 5+ unit buildings).
- Burke County population projected at -18% by 2050 — secular population decline; favor cash flow + early exit over multi-decade hold.
- Climate carrying-cost: moderate wildfire risk — expect insurance premiums to compound above CPI over the hold.
- Cap rate 6.4% vs local median 1.3% in Gamewell — top-decile yield for the area; either an underpriced asset or a hidden risk that comps aren't pricing in. Stress-test before assuming the spread holds.
- This rent runs 32% of the median local income ($58k/yr) — at the standard rent-burdened threshold; future hikes will face affordability resistance.
Questions for listing agent
- Built in 1968 — when were the roof, HVAC, electrical panel, plumbing, and water heater last replaced?
- Is there a deadline driving the sale (1031 exchange, divorce, estate, relocation)? That informs how much negotiation room exists.
- Schools are F-rated, which usually means shorter tenancies and higher turnover. Who's the typical renter profile here, and what's been the actual vacancy rate?
- The area grade is low — what's the realistic commute time and amenity access for the typical tenant pool here? Any planned neighborhood developments (good or bad) we should know about?
- What's the average days-on-market for RENTAL listings here right now (not sales)? A rising rental-DOM trend means longer vacancies and softer asking-rent achievability than the comps imply.
- What's the recent tenant-quality profile in this submarket — average credit score on applications, eviction rate, late-payment / NSF rate, and stable-employment percentage? A property-management company in the area should have these aggregated.
- How much new for-sale + rental construction is in the pipeline within 1–3 miles? Heavy new supply typically softens prices + rents 12–24 months out; constrained supply supports both.
CashFlowRE · CFR-VR67FFETTY2THC
· Data 6 days ago
cashflowre.app · 2026-05-29