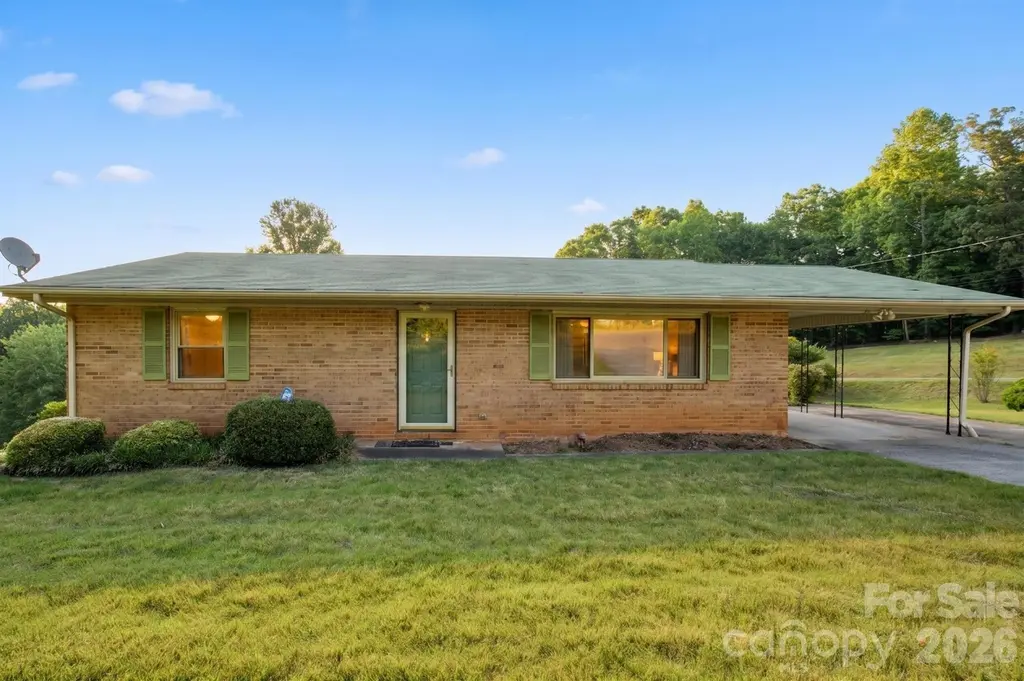
4024 Piney Rd · Gamewell, NC
Flood risk 1/10 · Minimal
- FEMA flood zone
- X (unshaded)
- Chance of flooding over 30 yrs
- 0.0%
- Est. flood insurance / yr
- $473 – $860
Fire risk 5/10 · Moderate
- Est. fire insurance / yr
- $906 – $1,684
Heat risk 4/10 · Minor
- Hot days now (above 103°F)
- 7 days/yr
- Hot days in 30 yrs
- 18 days/yr
Wind risk 2/10 · Minimal
- Chance of severe wind over 30 yrs
- 1.0%
Air-quality risk 2/10 · Minimal
- Unhealthy air days now
- 1 days/yr
- Unhealthy air days in 30 yrs
- 1 days/yr
Risk factors via First Street. Map © Google.
Why this score? — see what drove the D- grade
The composite is a weighted blend of 9 inputs, each scored 0–100. Each bar is that input's sub-score; the figure is the points it added to the 100-point composite (weight × sub-score).
- Cash flow +13.6/30.0
- ARV discount +7.8/15.0
- DSCR +4.1/10.0
- Schools +3.8/10.0
- Livability +3.0/5.0
- 1% rule +2.8/10.0
- Rent growth +2.5/5.0
- Condition / age +2.5/5.0
- Appreciation +0.0/10.0
$199,900
🖨 Deal sheet 📄 Offer letter ✓ Due diligence
Listing remarks
Tucked away in a private, secluded setting, this brick ranch offers the perfect opportunity to create your own peaceful retreat! Situated on a spacious lot with plenty of privacy, this home features solid construction, a functional layout, and endless potential for the right buyer. Inside, you’ll find generous living spaces ready for your personal touch and updates. Whether you’re looking for a primary residence, investment property, or a quiet country getaway, this property offers great bones and room to make it your own. Enjoy the serenity of nature, mature surroundings, and the comfort of a secluded location while still being conveniently located to Morganton amenities. ? Bri
Key facts
- 0.49 acre lot
- Built 1968
- Listed 17 days
Property features AI
Finance
- HOA & community: No HOA
Exterior
- Parking: Attached carport; Driveway
- Utilities: City water; Septic system installed
- Home design: Single-family residential home; Site-built construction; One level (with finished basement)
- Construction: Brick exterior; Basement foundation
- Exterior features: Concrete and paved road access; Publicly maintained road
Interior
- Kitchen: Electric cooktop; Electric range; Refrigerator
- Bedrooms: Two bedrooms on the main level; Two bedrooms in the basement (total of four bedrooms)
- Bathrooms: Two full bathrooms (one on main level, one in basement)
- Heating & cooling: Electric baseboard heating; Ceiling fans; Heat pump
- Interior features: Finished walk-out basement; One main-level room count listed
- Laundry & utility: Laundry located in the basement
Neighborhood map
What this means for you Summary
Snapshot
- This is a 3-bed/0.5-bath single-family listed at $200k.
Deal economics
- At list price, monthly cash flow is $12 ($142/yr) — positive.
- The deal already cash-flows at list — no discount required.
- To meet the 1% rule (rent ≥ 1% of price), the offer needs to be $155k (22.5% below list).
- Recommended offer: $155k (22.5% below list) — sets the bar for 1% rule.
- Cap rate 6.4% vs local median 1.3% in Gamewell — top-decile yield for the area; either an underpriced asset or a hidden risk that comps aren't pricing in. Stress-test before assuming the spread holds.
Location & tenants
- Location reads 60/100 on livability (#518 in NC) — a middle-class / working-renter tenant base. Strengths: cost of living A+, housing A+, crime B+; Watch: employment D, amenities F, commute F.
- Burke County Schools (rural): math 43% / reading 47% proficiency, ranked #89 of 178 in NC (top 50%) — families likely to look elsewhere, expect single-tenant / working-renter base with shorter leases.
- Zoned schools: Mountain View Elementary (math 32% / reading 28%, grade F, #965 of 1,410 statewide, top 69%, 677 students, 85% FRL); Freedom High (math 61% / reading 51%, grade C, #264 of 535 statewide, top 49%, 1,414 students, 64% FRL) — zoned schools average 74% FRL vs 52% district-wide (22 pts higher); higher-poverty schools than district average — tighter screening recommended.
- Market conditions: 431 active listings in the ZIP; 422 units permitted in Burke County in 2024 (94 in 5+ unit buildings).
- This rent runs 32% of the median local income ($58k/yr) — at the standard rent-burdened threshold; future hikes will face affordability resistance.
Forward outlook
- Local home prices are declining (-3.0%/yr); year-one equity from $1k of loan paydown is wiped out by about $6k of value loss. Plan a longer hold.
- Burke County population projected at -18% by 2050 — secular population decline; favor cash flow + early exit over multi-decade hold.
Negotiation context
- It's been on market 17 days — a 2% lower offer ($197k) is reasonable based on typical stale-listing flexibility.
Risks & watch-outs
- Climate carrying-cost: moderate wildfire risk — expect insurance premiums to compound above CPI over the hold.
Questions for the listing agent
- Built in 1968 — when were the roof, HVAC, electrical panel, plumbing, and water heater last replaced?
- Is there a deadline driving the sale (1031 exchange, divorce, estate, relocation)? That informs how much negotiation room exists.
- Schools are F-rated, which usually means shorter tenancies and higher turnover. Who's the typical renter profile here, and what's been the actual vacancy rate?
- The area grade is low — what's the realistic commute time and amenity access for the typical tenant pool here? Any planned neighborhood developments (good or bad) we should know about?
- What's the average days-on-market for RENTAL listings here right now (not sales)? A rising rental-DOM trend means longer vacancies and softer asking-rent achievability than the comps imply.
- What's the recent tenant-quality profile in this submarket — average credit score on applications, eviction rate, late-payment / NSF rate, and stable-employment percentage? A property-management company in the area should have these aggregated.
- How much new for-sale + rental construction is in the pipeline within 1–3 miles? Heavy new supply typically softens prices + rents 12–24 months out; constrained supply supports both.
Investment metrics
- 1% rule
- 0.78% ✗
- Cap rate
- 6.36%
- Cash-on-cash
- 0.25%
- DSCR
- 1.01
- GRM
- 10.8
CMA / ARV
- ARV (on-the-fly)
- $201,056
- Comps found
- 1
Show comp detail 1 sale within ~0.75 mi
| Address | Dist | Beds/Ba | Sqft | Sold | Price | $/sf | Match |
|---|---|---|---|---|---|---|---|
| 4080 Piney Rd | 0.10mi | 4/2.0 (+1) | 1,748 (-10%) | 23mo | $180,000 | $103 | 48 |
Match score weights: distance 35% · size 25% · config 20% · recency 20%. Top-matched comps best support the ARV.
Projected returns pro-forma
-3.0% appreciation · 3.0% rent growth · sell at horizon
- IRR
- -16.0%
- Equity multiple
- 0.43×
- Total profit
- $-31,719
- Equity at exit
- $29,806
- IRR
- -7.6%
- Equity multiple
- 0.52×
- Total profit
- $-26,978
- Equity at exit
- $17,284
Cash invested: $55,972 (down + closing). Projections, not guarantees.
Landlord ↔ Tenant lean methodology
- Overall (STATE)
- 85 Strongly Landlord-Friendly
- State North Carolina
- 85 Strongly Landlord-Friendly · R+3
- County
- — inherits STATE
- City
- — inherits STATE
ZIP-level market 28655
- Home prices YoY
- -13.2%
- Active inventory
- 431
- Price-to-rent
- 10.8×
Monthly cashflow live
- Estimated rent
- $1,549 medium interval (Pro) →
- Mortgage (P&I)
- −$1,048
- Tax from tax record
- −$81 /mo · $967/yr
- Insurance
- −$83
- HOA
- −$0
- Vacancy / Maint / Mgmt
- −$325
- Net cashflow
- $12
Break-even live
UW: 25.0% down · 7.5% · 30yr · 1.5% tax · 5.0% vac · 8.0% maint · 8.0% mgmt
Financing live
Cash to close
- Down payment
- $49,975
- Closing costs
- $5,997
- Reserves months
- —
- Total cash needed
- —
Loan-product check · same deal, 3 products live
Conventional
25% down · 7.5% · 30yr
- Down + closing
- —
- Monthly P&I
- —
- Monthly cashflow
- —
- DSCR
- —
- Eligible?
- —
Personal DTI + credit; lowest rate.
DSCR
20% down · 8.5% · 30yr
- Down + closing
- —
- Monthly P&I
- —
- Monthly cashflow
- —
- DSCR
- —
- Eligible?
- —
No personal income docs; deal must DSCR.
Hard money
10% down · 12.0% · 12mo
- Down + closing
- —
- Monthly P&I
- —
- Monthly cashflow
- —
- DSCR
- —
- Eligible?
- —
Short-term bridge; refi at stabilization.
Listing history 11 events
-
2026-06-13status $199,900 Pending 17 DOM
-
2026-06-10days on market $199,900 Active Under Contract 17 DOM
-
2026-06-09days on market $199,900 Active Under Contract 16 DOM
-
2026-06-08days on market $199,900 Active Under Contract 15 DOM
-
2026-06-07days on market $199,900 Active Under Contract 14 DOM
-
2026-06-05statusdays on market $199,900 Active Under Contract 11 DOM
-
2026-06-02days on market $199,900 Active 9 DOM
-
2026-06-01days on market $199,900 Active 8 DOM
-
2026-05-31days on market $199,900 Active 7 DOM
-
2026-05-30days on market $199,900 Active 6 DOM
-
2026-05-23historical $199,900
ⓘ Source: listings_history table (triggers on properties + properties_extension) + one-shot
backfill from property_details.listing_events for pre-trigger history.
Tax reassessment forecast NC · Resets to sale price
- Current annual tax
- $967 · $81/mo
- Projected year-2 tax
- $1,639 · $137/mo
- Expected delta
- +$672/yr (+$56/mo · 69.4%)
ⓘ Screening estimate from a state-policy table — verify with the county assessor before closing.
Climate risk First Street
- Flood 1/10 Low FEMA zone X (unshaded) · 0% chance over 30 yrs
- Wildfire 5/10 Major
- Heat 4/10 Moderate 7 d/yr ≥103°F today · 18 d/yr by 30 yrs out
- Wind 2/10 Low 100% chance of damaging wind over 30 yrs
- Air quality 2/10 Low 1 unhealthy d/yr today · 1 by 30 yrs out
Nearby sold comps map
Loading sold comps map…
Walkable amenities ~0.75 mi
Loading nearby amenities…
Taxation est. · year 1
- Rental income
- $18,593
- − Mortgage interest
- −$11,198
- − Property taxes
- −$967
- − Insurance
- −$1,000
- − Repairs & maintenance
- −$1,487
- − Management
- −$1,487
- − Depreciation
- −$5,815
- Taxable loss
- −$3,362
- Est. tax savings @ 24.0%
- +$807
- After-tax cash flow
- $949/yr
For passive investors: Depreciation is non-cash, so a rental often shows a tax loss while cash-flowing — sheltering income. Rental losses are passive: they offset passive income freely, and up to $25,000/yr can offset ordinary (W-2) income if you actively participate and your MAGI is under $100k (phasing out to $0 by $150k); unused losses carry forward. On sale, claimed depreciation is recaptured at up to 25%, and gains may owe capital-gains tax (a 1031 exchange can defer both). Figures are a year-1 estimate at your 24.0% rate — not tax advice; consult a CPA.
Schools (NCES district)
- District
- Burke County Schools
- NCES district ID
- 3700480
- Math proficiency
- 43% ▼ -2.00%
- Reading proficiency
- 47% ▬ 0.00%
- Median HH income
- $38,342
- Composite
- 37.51/100
- National rank
- #4400
- State rank
- #89 of 178 in NC
Livability — Gamewell
- Score
- 60/100
- State rank
- #518
- US rank
- #19047
Category grades
Schools grade is shown separately in the Schools card above.
Census & demographics
- County
- Burke County · 55,100 people
- Metro
- Hickory-Lenoir-Morganton, NC
- Population (ZIP)
- 55,100
- Household income
- $57,713
- Rent vs Own
- Severe rent burden
- 1145.0
Population outlook (Burke County) Hauer SSP2
- Today (2025)
- 86,552 people
- By 2030
- 84,123 · -2.8%
- By 2040
- 78,165 · -9.7%
- By 2050
- 71,099 · -17.9%
- By 2075
- 56,264 · -35.0%
- By 2100
- 44,742 · -48.3%
Race, ethnicity, and origin ACS 2023
- Neighborhood character
- Predominantly White (75%)
- Race & ethnicity
- White 75% Hispanic / Latino 11% Black 8% Two or more races 5% Asian 3% Native American 2%
- Hispanic origin (detail)
- Mexican 3%
- Common ancestry
- Slovak 2% Italian 2% Serbian 2%
- Foreign-born
- 7% · Canada, China
- Languages at home
- 87% English-only · Spanish 8% Other Asian/Pacific 1% Arabic 1%
Political lean MEDSL · Burke
- 2024 margin
- Solid R (+41.2) · D 29.0% · R 70.3%
- 2008→2024 swing
- -22.0pp toward R · 2008: -19.2pp · 2024: -41.2pp
- All cycles
- 2024: R+41.2 2020: R+40.1 2016: R+39.4 2012: R+23.6 2008: R+19.2
Not yet ingested
- Civics
- —
Market trends
- HPI YoY
- ▼ -55.07%
- Current HPI
- 362.0732
- Rent YoY
- —
- Metro
- Hickory-Lenoir-Morganton, NC
- State GDP YoY
- ▲ 3.28%
- F500 in state
- 26
Industry mix (Fortune 500 HQ in NC)
| Industry | F500 HQs | Revenue |
|---|---|---|
| Financial Services | 2 | $213B |
|
||
| Retail | 2 | $95B |
|
||
| Industrial Conglomerate | 1 | $38B |
|
||
| Metals / Steel | 1 | $35B |
|
||
| Utilities | 1 | $30B |
|
||
| Industrial Machinery | 1 | $19B |
|
||
Price history
1 event — show timeline
- 2026-05-23 Coming Soon $199,900 CANOPYMLS as Distributed by MLS Grid
Property tax history
+2.8%/yrLatest (2025): $967 · -0.2% YoY. Source: county tax records.
Cash-flow waterfall
monthlySold comps — $/sqft
last 12 mo · ≤1 miLoading sold comps…