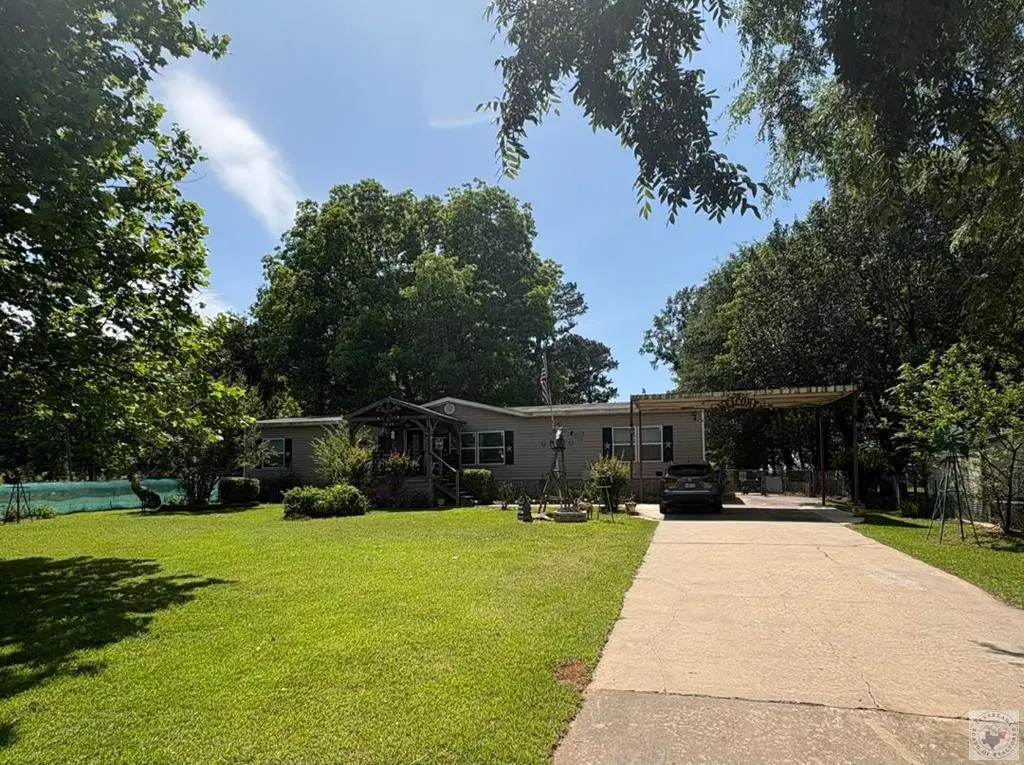
4225 Trexler Rd Trexler Dr
Redwater, TX 75501
$185,000D
4 bd · 2.0 ba ·
2,040 sqft ·
Built 2017
· Manufactured
· Active
· 33 DOM
Cashflow @ list (25.0% down · 7.5%)
Estimated rent
$1,512/mo
Mortgage (P&I)
−$970
Tax + insurance
−$230
HOA
−$0
Vac / Maint / Mgmt
−$318
Net cashflow
$-5/mo
Annual
$-61/yr
Cap rate
6.26%
Cash-on-cash
-0.12%
DSCR
0.99
1% rule
0.82%
Cash to close
$51,800
Investor read
- This is a 4-bed/2.0-bath manufactured listed at $185k.
- At list price, monthly cash flow is $-5 ($-61/yr) — negative.
- To cash-flow at today's rent, offer at most $184k (0.5% below list).
- To meet the 1% rule (rent ≥ 1% of price), the offer needs to be $151k (18.3% below list).
- It's been on market 33 days — a 3% lower offer ($179k) is reasonable based on typical stale-listing flexibility.
- Recommended offer: $151k (18.3% below list) — sets the bar for 1% rule.
- Local home prices are declining (-3.0%/yr); year-one equity from $1k of loan paydown is wiped out by about $6k of value loss. Plan a longer hold.
- Location reads 68/100 on livability (#467 in TX) — a middle-class / working-renter tenant base. Strengths: cost of living A+, housing A, crime A-; Watch: amenities F, commute F, health & safety F.
- Redwater ISD (rural): math 58% / reading 48% proficiency, ranked #123 of 826 in TX (top 15%) — acceptable for families but not a draw, mixed tenant base, ~2y average lease.
- Zoned schools: Redwater El (math 42% / reading 47%, grade F, #1,155 of 4,322 statewide, top 29%, 313 students, 54% FRL); Redwater Int (math 55% / reading 34%, grade D, #491 of 1,662 statewide, top 31%, 227 students, 62% FRL); Redwater H S (math 77% / reading 67%, grade B+, #95 of 1,632 statewide, top 7%, 339 students, 44% FRL) — zoned schools average 53% FRL vs 36% district-wide (17 pts higher); higher-poverty schools than district average — tighter screening recommended.
- Market conditions: Rents rising (+1.6%/yr); 326 active listings in the ZIP; 1 comparable units currently listed for rent nearby; 137 units permitted in Bowie County in 2024 (5 in 5+ unit buildings).
- Climate carrying-cost: major wind risk, 27% chance of damaging wind over 30y; major wildfire risk; extreme-heat days projected 7→23/yr by 2055 (HVAC capex compounding) — expect insurance premiums to compound above CPI over the hold.
- This rent runs 39% of the median local income ($46k/yr) — at the standard rent-burdened threshold; future hikes will face affordability resistance.
Questions for listing agent
- What do current leases actually rent for vs. the listed asking? Can we see a recent rent roll and the last 12 months of T-12 income?
- It's been on market 33 days. Have you received any prior offers? Is the seller open to a 18% concession, seller financing, or rate buy-down credit?
- Is there a deadline driving the sale (1031 exchange, divorce, estate, relocation)? That informs how much negotiation room exists.
- The area grade is low — what's the realistic commute time and amenity access for the typical tenant pool here? Any planned neighborhood developments (good or bad) we should know about?
- What's the average days-on-market for RENTAL listings here right now (not sales)? A rising rental-DOM trend means longer vacancies and softer asking-rent achievability than the comps imply.
- What's the recent tenant-quality profile in this submarket — average credit score on applications, eviction rate, late-payment / NSF rate, and stable-employment percentage? A property-management company in the area should have these aggregated.
- How much new for-sale + rental construction is in the pipeline within 1–3 miles? Heavy new supply typically softens prices + rents 12–24 months out; constrained supply supports both.
CashFlowRE · CFR-VR69DR5SBVSSRV
· Data 2 weeks ago
cashflowre.app · 2026-05-29